Free Access
Fig. 5
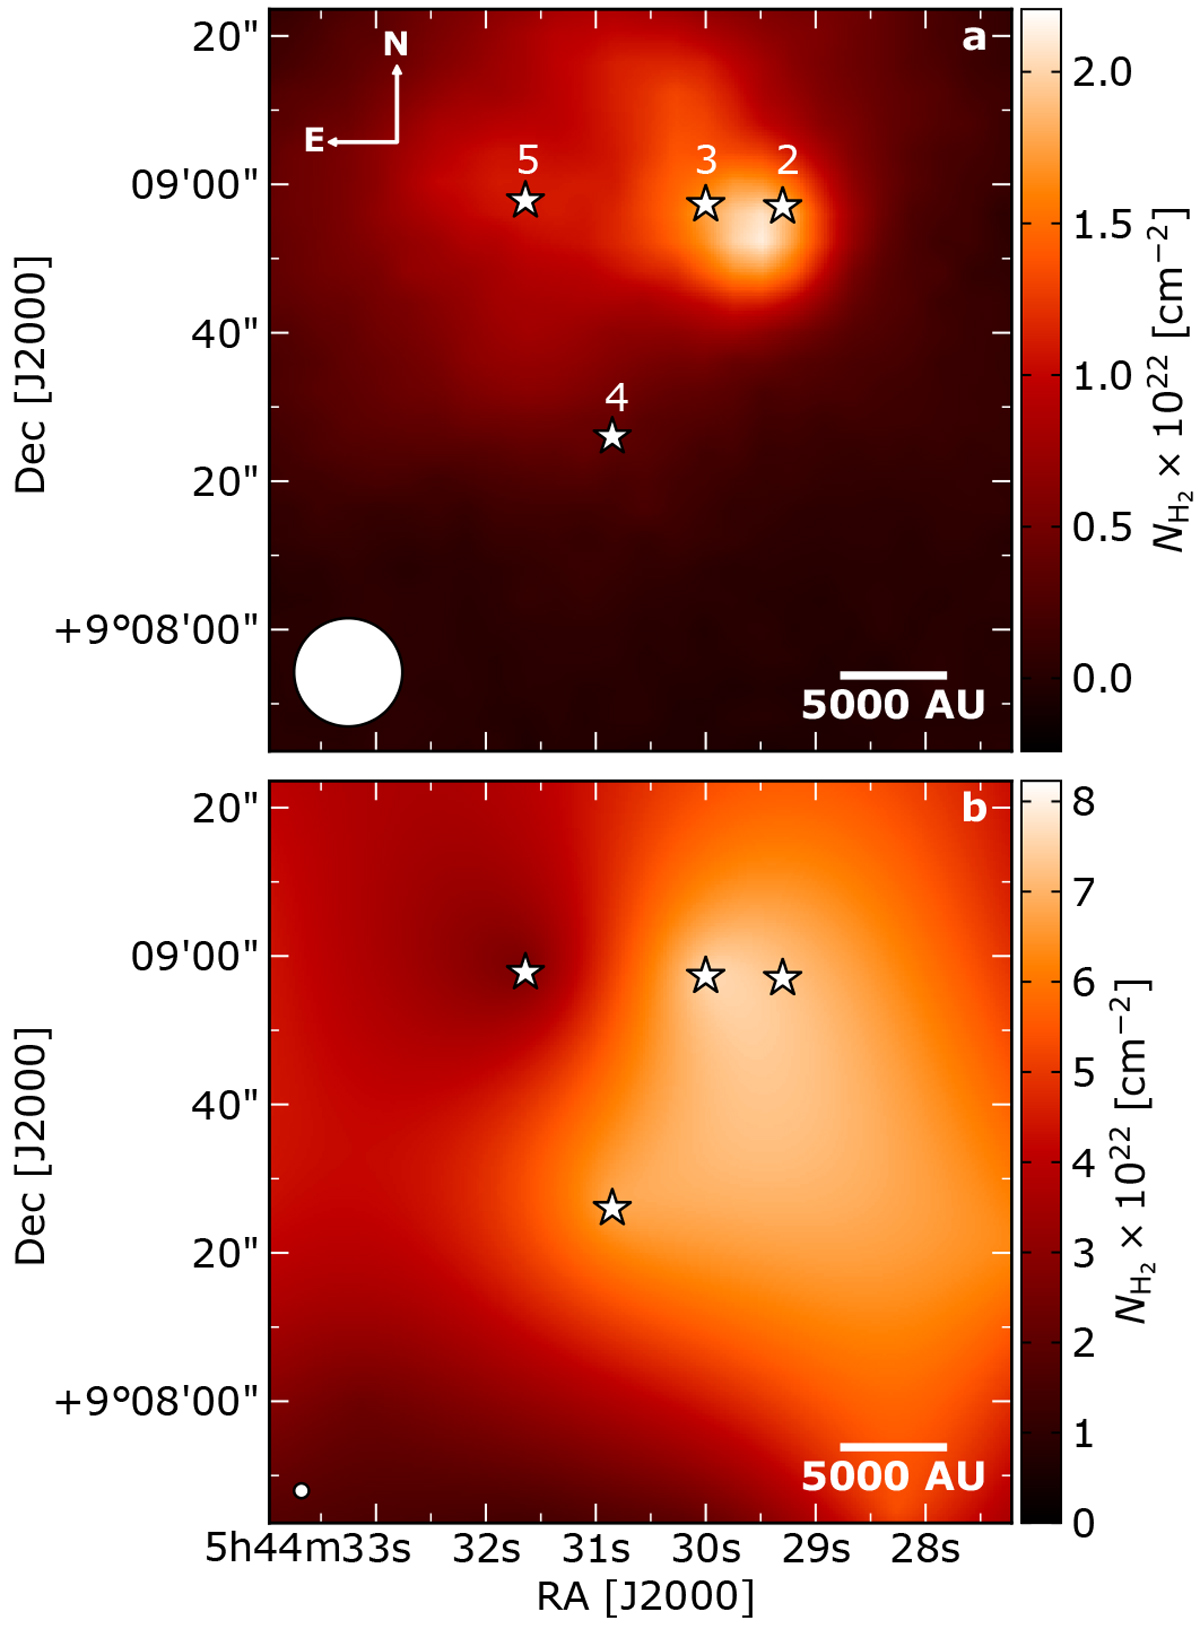
H2 column density maps of B35A. a:
![]() map calculated from SCUBA−2 dust emission at 850 μm (Reipurth & Friberg 2021). b:
map calculated from SCUBA−2 dust emission at 850 μm (Reipurth & Friberg 2021). b:
![]() map calculated from the visual extinction. The synthesised beams are displayed in white in the bottom left corner of each panel. The white stars mark the positions of the targeted B35A sources.
map calculated from the visual extinction. The synthesised beams are displayed in white in the bottom left corner of each panel. The white stars mark the positions of the targeted B35A sources.
Current usage metrics show cumulative count of Article Views (full-text article views including HTML views, PDF and ePub downloads, according to the available data) and Abstracts Views on Vision4Press platform.
Data correspond to usage on the plateform after 2015. The current usage metrics is available 48-96 hours after online publication and is updated daily on week days.
Initial download of the metrics may take a while.