Fig. 3
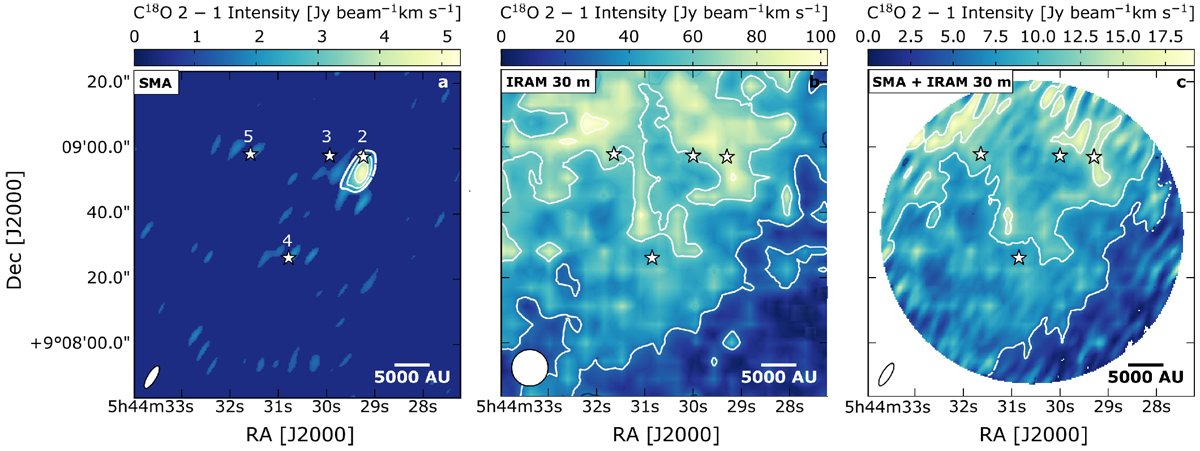
Integrated intensity maps for C18O J = 2 detected by the SMA (panel a), by the IRAM 30 m telescope (panel b), and in the combined interferometric SMA and single-dish IRAM 30 m data (panel c). All lines are integrated between 10 and 15 km s−1. Contours are at 5, 10, and 15σ (σSMA = 0.37 Jy beam−1 km s−1, σIRAM 30 m = 5 Jy beam−1 km s−1, σSMA+IRAM 30 m = 0.40 Jy beam−1 km s−1). Panel c: white area outlines the primary beam of the SMA observations. The synthesised beams are displayed in white in the bottom left corner of each panel. The white stars mark the positions of the targeted B35A sources.
Current usage metrics show cumulative count of Article Views (full-text article views including HTML views, PDF and ePub downloads, according to the available data) and Abstracts Views on Vision4Press platform.
Data correspond to usage on the plateform after 2015. The current usage metrics is available 48-96 hours after online publication and is updated daily on week days.
Initial download of the metrics may take a while.