Free Access
Fig. B.1
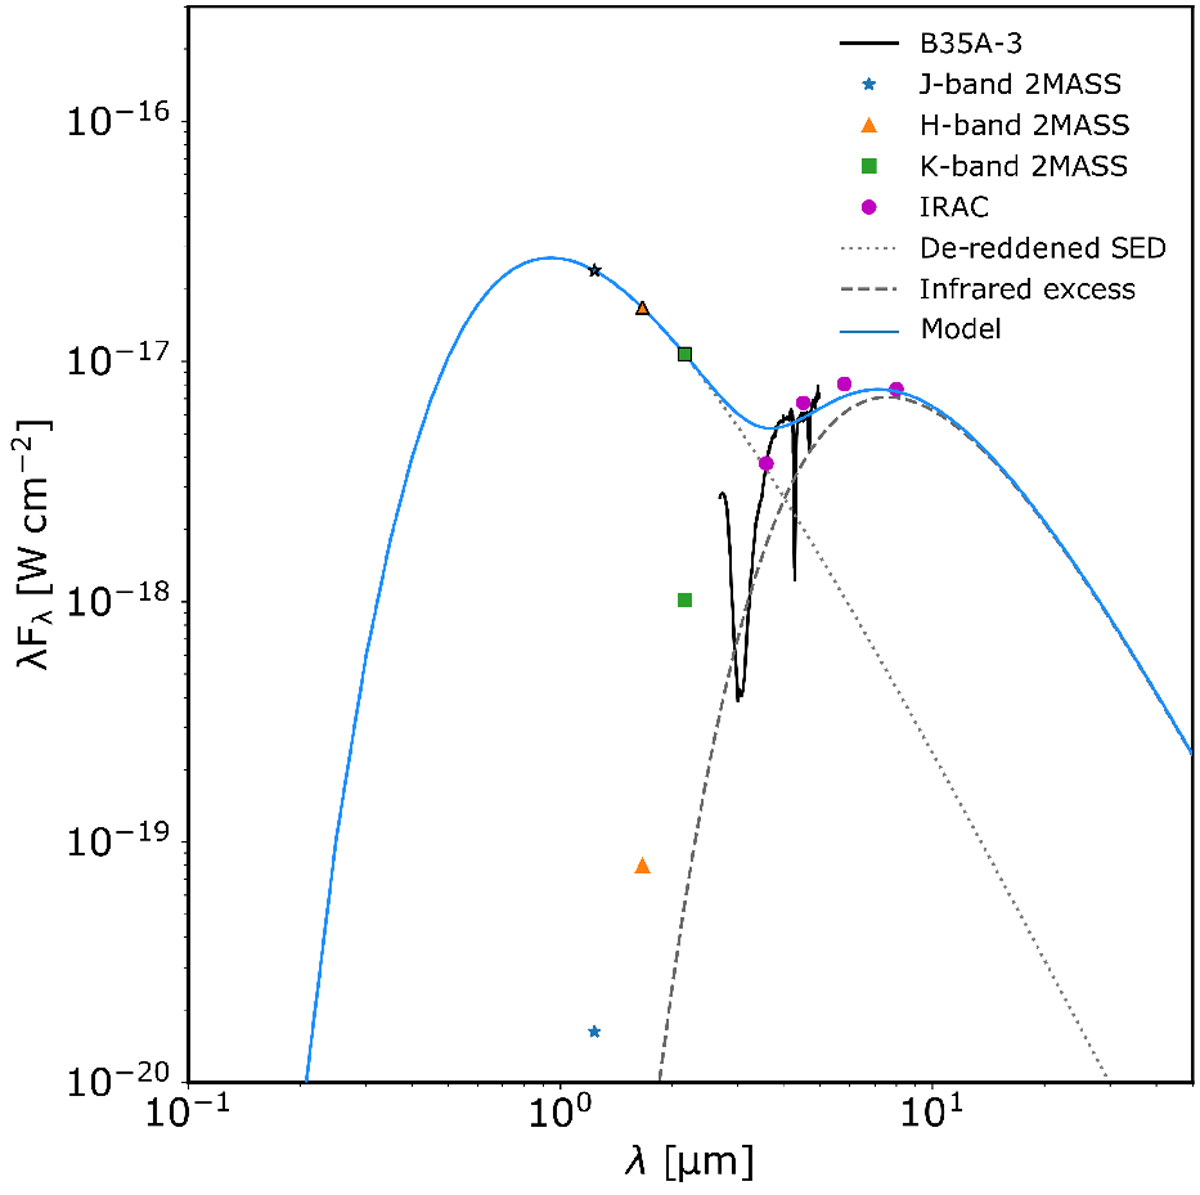
SED of B35A−3, which was modelled to determine its visual extinction. The dotted and dashed lines represent the blackbody functions used to model the stellar component and the infrared excess, respectively. The solid line is the sum of the two contributions.
Current usage metrics show cumulative count of Article Views (full-text article views including HTML views, PDF and ePub downloads, according to the available data) and Abstracts Views on Vision4Press platform.
Data correspond to usage on the plateform after 2015. The current usage metrics is available 48-96 hours after online publication and is updated daily on week days.
Initial download of the metrics may take a while.