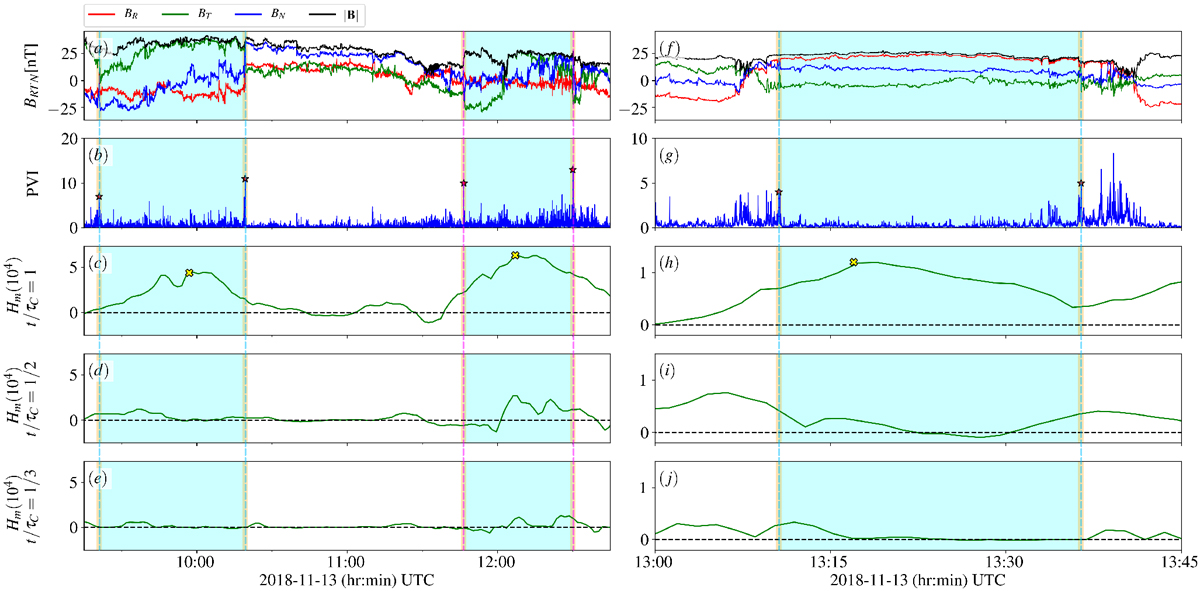
Fig. 5

Two close-ups of Fig. 4 from 9:15 to 12:45 (left panels) and from 13:00 to 13:45 (right panels). The figure reports the magnetic field (a) and (f); the PVI signal (b) and (g); and the magnetic helicity evaluated at one correlation time (c), (h), 1∕2 correlation time (d), (i), and 1∕3 of the correlation time (e) and (j). It is interesting to notice that the Hm shape heavily depends on the chosen window, suggesting a multi-scale nature of helical structures. The vertical cyan and magenta lines highlight the position of strong PVI events edging high-helicity regions (cyan shaded regions). Left panels: two structures that are bounded by two strong PVI events each (cyan lines for the first event and magenta lines for the second). At scales smaller than one correlation time, the Hm signal shows a fragmentation of the structure, highlighting sub-features within the helical structure. Moreover, the two identified cores might be enclosed within a larger helical structure, possibly bounded by the leftmost cyan and rightmost magenta lines. This description is also consistent with the reconstruction performed by Chen et al. (2020; their Fig. 4), which shows a large island with two inner structures. On the other hand, the right panels show a smaller structure at t∕τC = 1, clearly bounded by PVI events, which has no internal features.
Current usage metrics show cumulative count of Article Views (full-text article views including HTML views, PDF and ePub downloads, according to the available data) and Abstracts Views on Vision4Press platform.
Data correspond to usage on the plateform after 2015. The current usage metrics is available 48-96 hours after online publication and is updated daily on week days.
Initial download of the metrics may take a while.


