Fig. 7
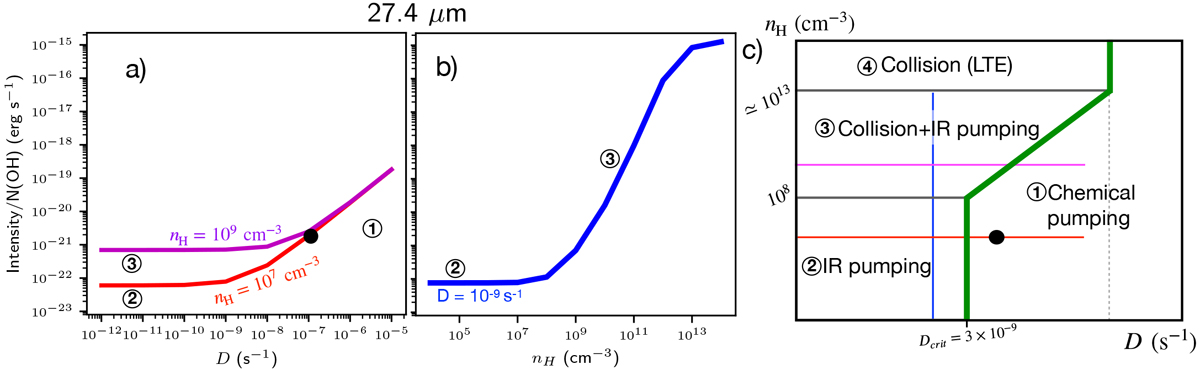
Transition from prompt emission to thermal or radiative excitation as revealed by the intensity of the intermediate N = 10 rotational line at 27.4 μm. The dominant excitation processes are indicated by ①, ②, ③, ④ as defined in Fig. 5. (a) Line intensity normalized by N(OH) as a function of ![]() . The transition between prompt emission and radiative pumping or collisions depends on
. The transition between prompt emission and radiative pumping or collisions depends on
![]() and on nH. In particular, one can define a critical pumping rate
and on nH. In particular, one can define a critical pumping rate ![]() below whichthermal or radiative excitation processes take over from prompt emission. (b) Line intensity normalized by
N(OH) as a function of nH for
below whichthermal or radiative excitation processes take over from prompt emission. (b) Line intensity normalized by
N(OH) as a function of nH for ![]() . (c) Schematic parameter space indicating the dominant excitation process of the
N = 10 line as a function of nH and
. (c) Schematic parameter space indicating the dominant excitation process of the
N = 10 line as a function of nH and
![]() . We note that whereas the specific values of
. We note that whereas the specific values of ![]() and nH reported in the x- and y-axis are for the N = 10 line, this schematic view remains valid for any rotational line. The prompt emission region is delimited by
and nH reported in the x- and y-axis are for the N = 10 line, this schematic view remains valid for any rotational line. The prompt emission region is delimited by
![]() (green line). The regime ① corresponds to the excitation regime of high-N
lines whereas the regimes ②, ③ and ④ correspond to the excitation regime of low-N
lines. Panels (a) and (b) are cuts in the parameter space and are indicated by red, magenta and blue lines. The temperature of the IR background, the kinetic temperature and the column density of OH are fixed to their fiducial values. The other parameters are indicated in each panel.
(green line). The regime ① corresponds to the excitation regime of high-N
lines whereas the regimes ②, ③ and ④ correspond to the excitation regime of low-N
lines. Panels (a) and (b) are cuts in the parameter space and are indicated by red, magenta and blue lines. The temperature of the IR background, the kinetic temperature and the column density of OH are fixed to their fiducial values. The other parameters are indicated in each panel.
Current usage metrics show cumulative count of Article Views (full-text article views including HTML views, PDF and ePub downloads, according to the available data) and Abstracts Views on Vision4Press platform.
Data correspond to usage on the plateform after 2015. The current usage metrics is available 48-96 hours after online publication and is updated daily on week days.
Initial download of the metrics may take a while.