Fig. 5
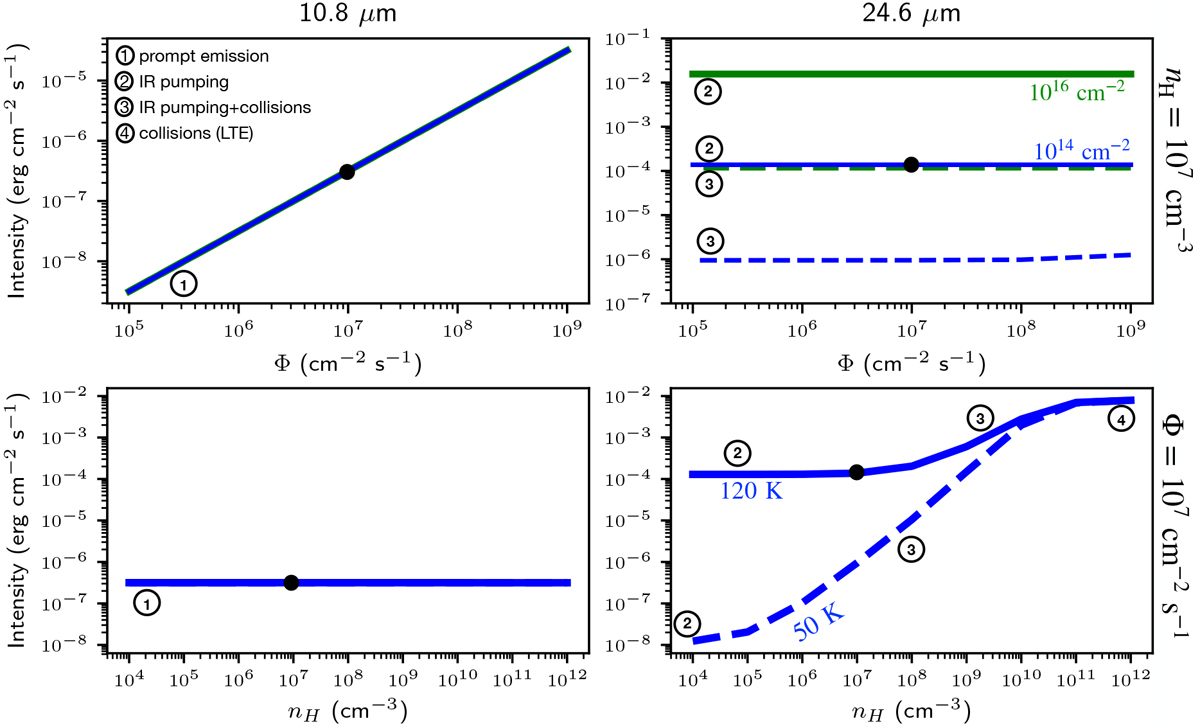
OH line intensities and the associated excitation processes as a function of Φ and nH for various values of N(OH) and TIR. The color indicates the value of N(OH) and the line style the value of TIR as defined in the right panels. The black circle indicates the fiducial model. The processes that dominate the excitation of the lines depending on the explored parameters are indicated along each curve. Left: intra-ladder rotational line at 10.8 μm coming from a high-N level (N = 30, Eup = 22600 K). This line depends only on Φ. Right: cross-ladder rotational line at 24.6 μm coming from a low-N level (N = 5, Eup = 875 K). This line traces the bulk population of OH. As such, it depends on N(OH), TIR and nH but does not depend on Φ.
Current usage metrics show cumulative count of Article Views (full-text article views including HTML views, PDF and ePub downloads, according to the available data) and Abstracts Views on Vision4Press platform.
Data correspond to usage on the plateform after 2015. The current usage metrics is available 48-96 hours after online publication and is updated daily on week days.
Initial download of the metrics may take a while.