Fig. 11
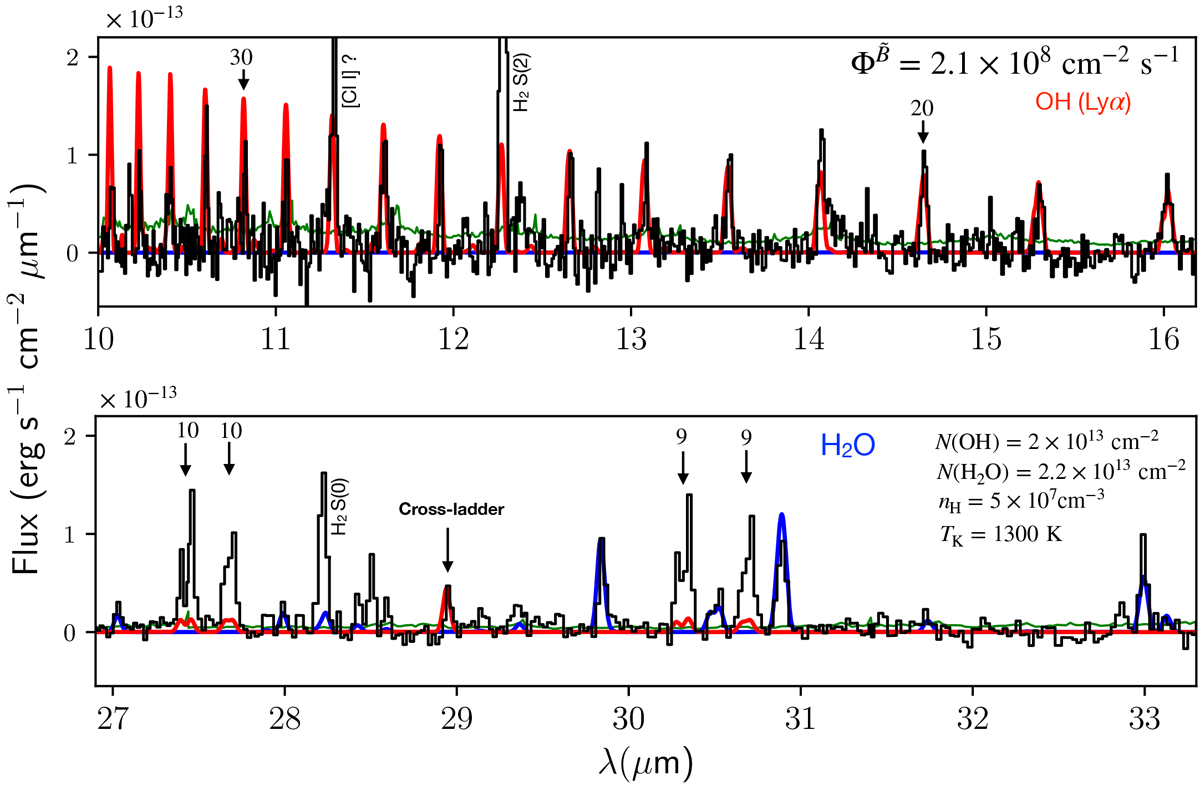
Comparison of the Spitzer-IRS mid-IR spectrum of the tip of HH 211 outflow from Tappe et al. (2008) (black lines) and of a synthetic GROSBETA spectrum for OH (in red) and H2O (in blue). The best fit parameters are indicated in the top right parts of the panels. The GROSBETA spectra are plotted assuming a source size equal to the extraction aperture ΔΩ = 1.9 × 10⁻⁹ sr. The rotational quantum number Nup are indicated for some OH lines. The model reproduces well the OH lines at 10–16 μm, but underproduces them at longer wavelengths.
Current usage metrics show cumulative count of Article Views (full-text article views including HTML views, PDF and ePub downloads, according to the available data) and Abstracts Views on Vision4Press platform.
Data correspond to usage on the plateform after 2015. The current usage metrics is available 48-96 hours after online publication and is updated daily on week days.
Initial download of the metrics may take a while.