Fig. 6.
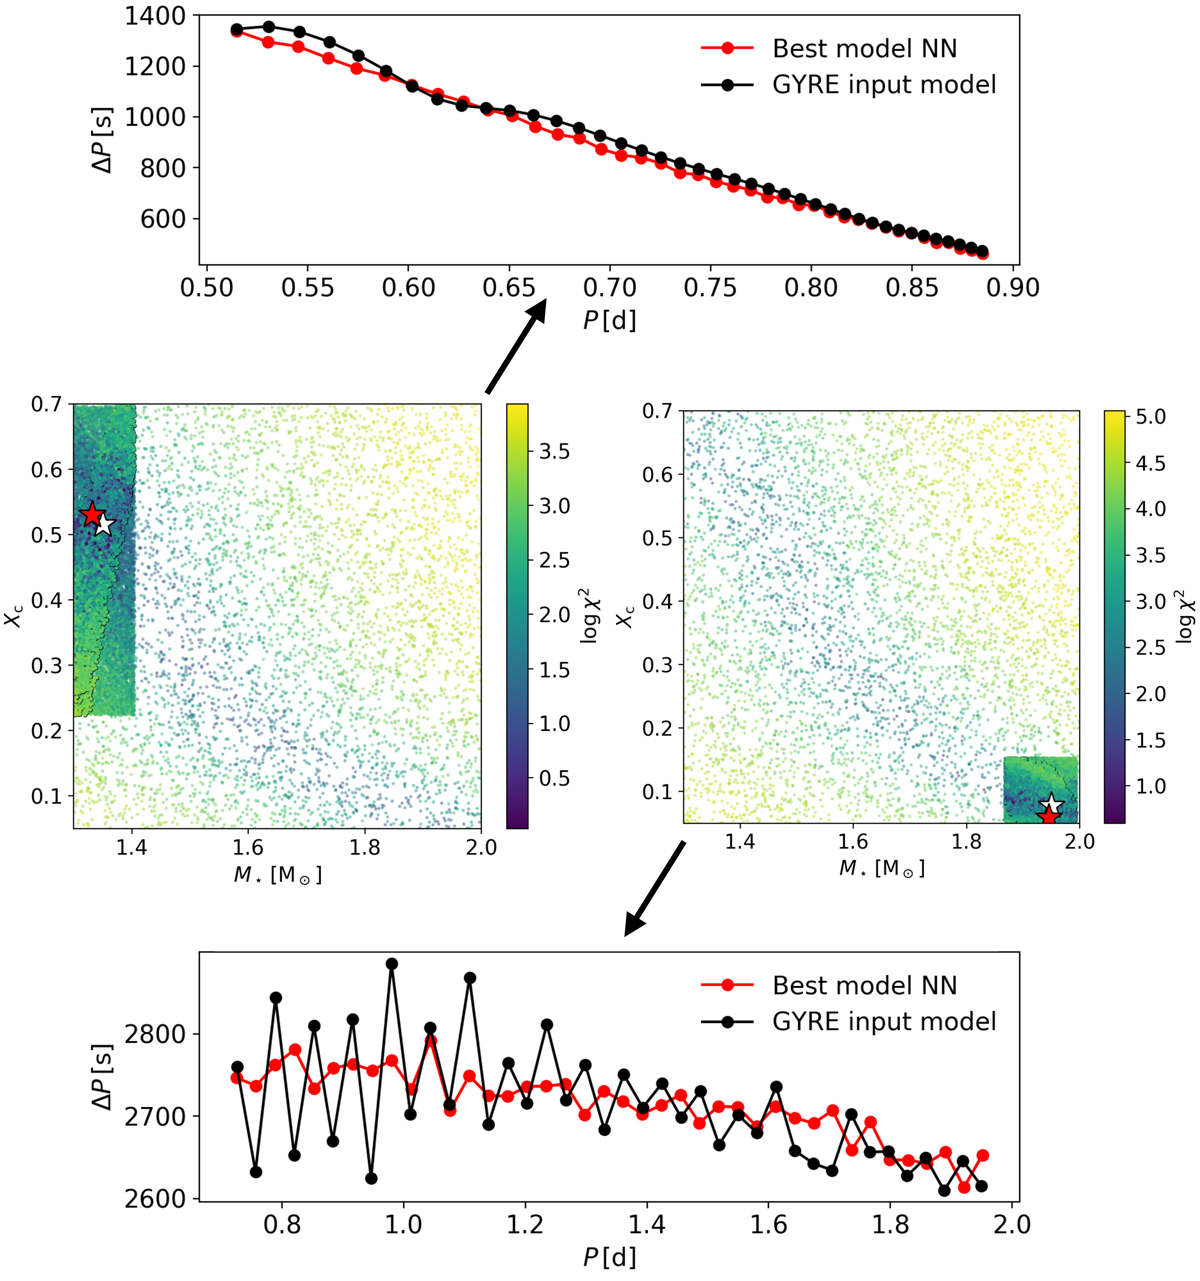
Examples of the recovered mass and Xc of two benchmark models (white stars: input; red stars: best model predicted by NN). Although the period spacings of trapped modes are more difficult to predict (bottom panel), the inclusion of the photospheric observables yields accurate predictions of the mass and Xc. Middle panels: sampling density is increased in the parameter space where the predicted photospheric observables comply with those of the input model (see Sect. 3). Model 1: (M⋆, Xc, Z, fov, D0, frot) = (1.35 M⊙, 0.515, 0.014, 0.0225, 1 cm2 s−1, 0.7457 d−1). Model 2: (M⋆, Xc, Z, fov, D0, frot) = (1.95 M⊙, 0.08, 0.014, 0.0225, 1 cm2 s−1, 0.0449 d−1). Typical uncertainties on ΔP are of the order of several tens of seconds.
Current usage metrics show cumulative count of Article Views (full-text article views including HTML views, PDF and ePub downloads, according to the available data) and Abstracts Views on Vision4Press platform.
Data correspond to usage on the plateform after 2015. The current usage metrics is available 48-96 hours after online publication and is updated daily on week days.
Initial download of the metrics may take a while.