Fig. 6
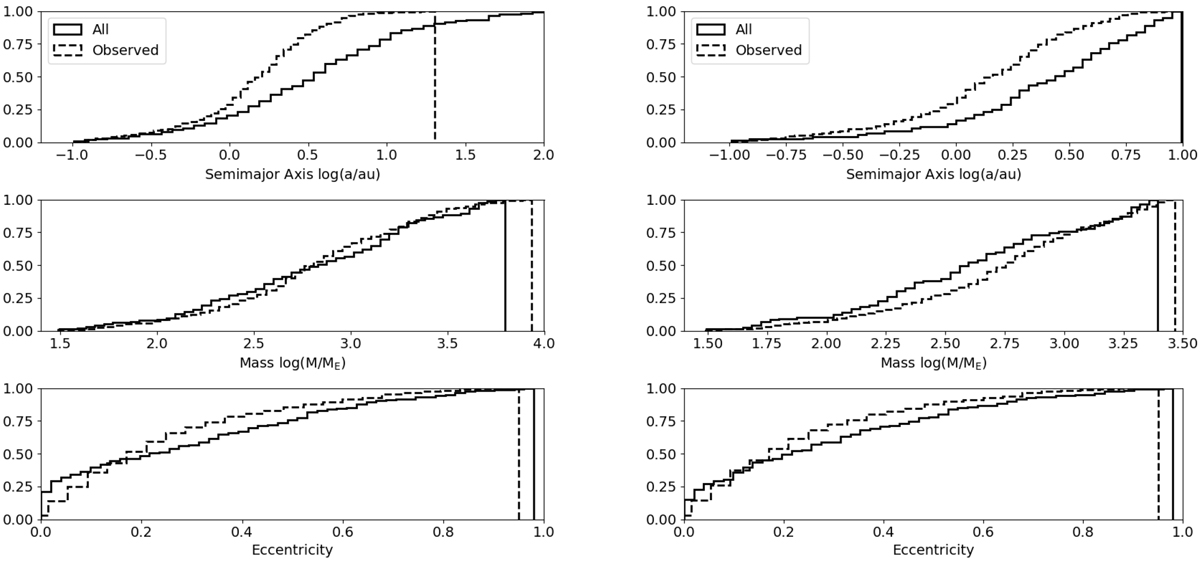
Distributions of semi-major axis (top), planetary mass (middle), and eccentricity (bottom). The solid and dashed lines correspond to simulated and RV-detected planets, respectively. The left panels include all the giant planets beyond 0.1 au, while the right ones are limited to orbital radii of 0.1–10 au and masses up to 3000 ME. The K–S test cannot reject the null hypothesis for the mass distribution on the left with the statistics of 0.092 and the P value of 0.11, but rejects the null hypothesis for all other cases. Our simulations clearly produce more giant planets in the outer region compared to observed systems. However, the agreements are not bad by eye for both masses and eccentricities.
Current usage metrics show cumulative count of Article Views (full-text article views including HTML views, PDF and ePub downloads, according to the available data) and Abstracts Views on Vision4Press platform.
Data correspond to usage on the plateform after 2015. The current usage metrics is available 48-96 hours after online publication and is updated daily on week days.
Initial download of the metrics may take a while.