Fig. 5
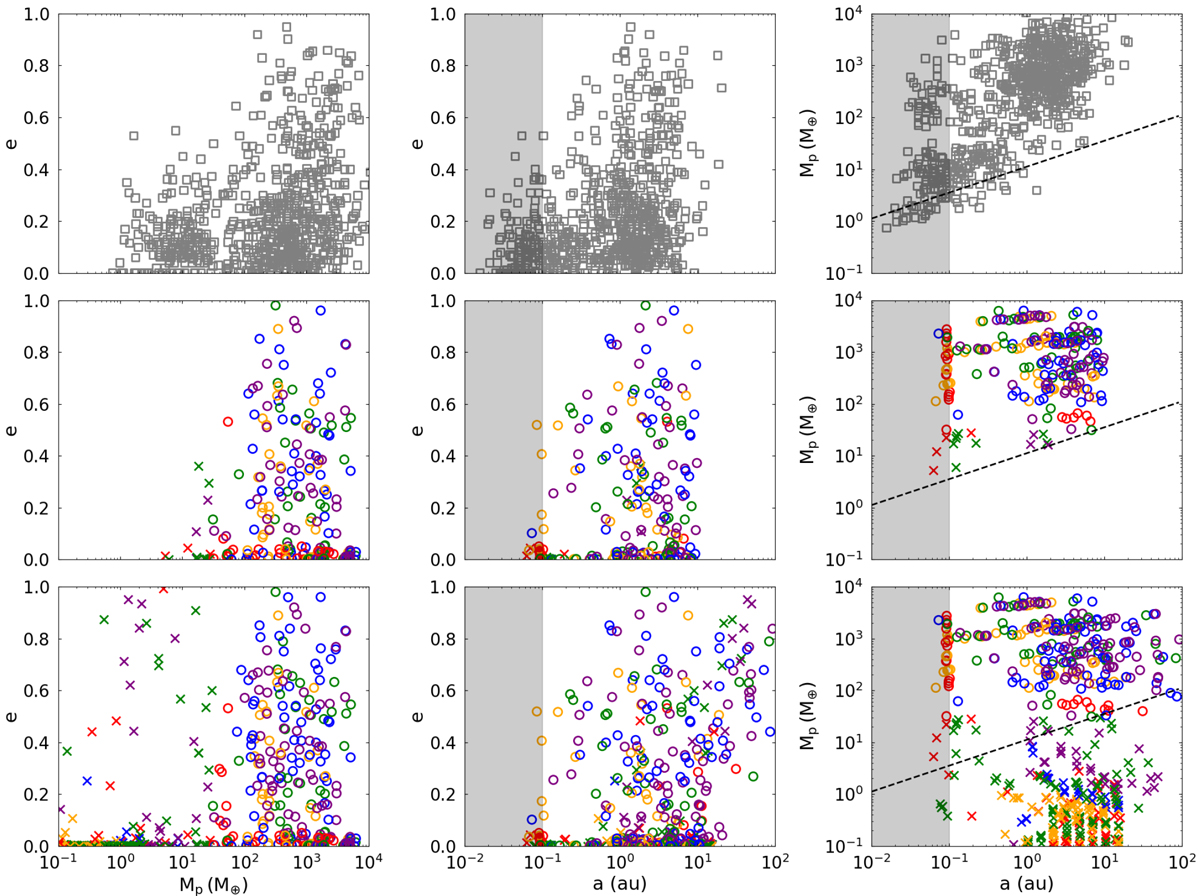
Comparison of distributions of parameters for the observed exoplanets and left, middle, and right panels are Mp − e, a − e, and a −Mp distributions, respectively. The top panels show observed data from the RV-detected planets. The bottom panels show all the simulated planets at the end of the simulations (100 Myr), while the middle panels show observable planets with the RV detection limit of 1 m s−1 and a ≤ 10 au. The black dashed line shown on a − Mp panels corresponds to 1 m s−1 limit. The shaded areas in a − e and a −Mp distributionsindicate that the inner disc edge of our model is at 0.1 au, and thus we do not intend to reproduce planet distributions there. Circles and crosses represent giant (≳ 0.1 MJ) and low-mass (<0.1 MJ) planets, respectively, and the red, orange, green, blue, and purple colours correspond to stellar metallicities of − 0.5, −0.3, 0.0, 0.3, and 0.5, respectively. Some planets are clustered around 0.1 au because the disc’s inner edge is set there.
Current usage metrics show cumulative count of Article Views (full-text article views including HTML views, PDF and ePub downloads, according to the available data) and Abstracts Views on Vision4Press platform.
Data correspond to usage on the plateform after 2015. The current usage metrics is available 48-96 hours after online publication and is updated daily on week days.
Initial download of the metrics may take a while.