Fig. 4
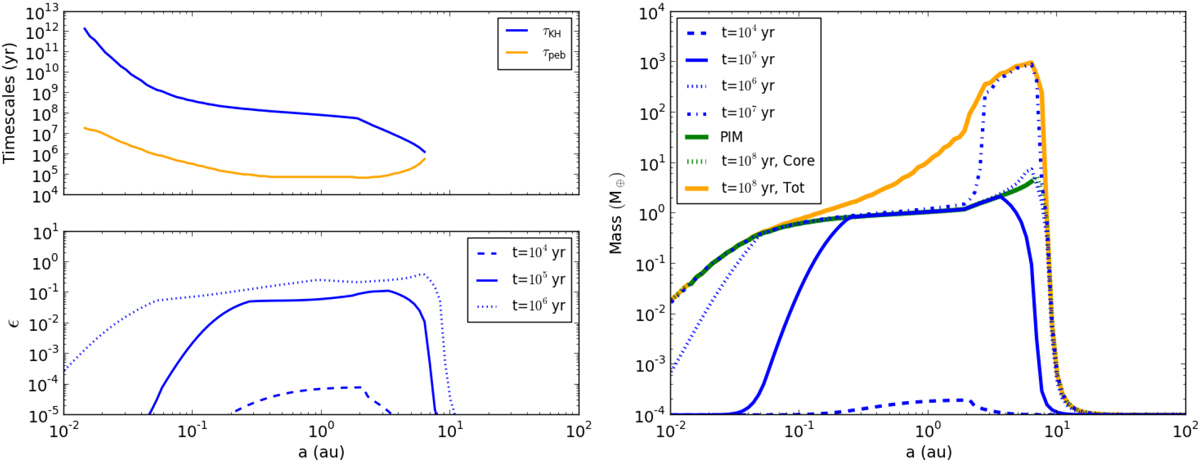
Top left panel compares the total time to form the protoplanetary core with the pebble isolation mass (orange, τpeb) with the Kelvin-Helmholtz gas accretion timescale for the PIM core (blue, τKH). The right panel shows the planetary mass growth at different times starting from 10−4 ME in Disc 5. The solid green line shows the PIM, while the dotted green line represents the core masses at 100 Myr (i.e. at the end of the simulations) for the cores not reaching PIMs. The orange line shows the final total mass. Here, the effects of the snow line are ignored. The bottom left panel shows the corresponding pebble accretion efficiencies by Ida et al. (2016) at different times as a core grows from 10−4 ME.
Current usage metrics show cumulative count of Article Views (full-text article views including HTML views, PDF and ePub downloads, according to the available data) and Abstracts Views on Vision4Press platform.
Data correspond to usage on the plateform after 2015. The current usage metrics is available 48-96 hours after online publication and is updated daily on week days.
Initial download of the metrics may take a while.