Fig. 1
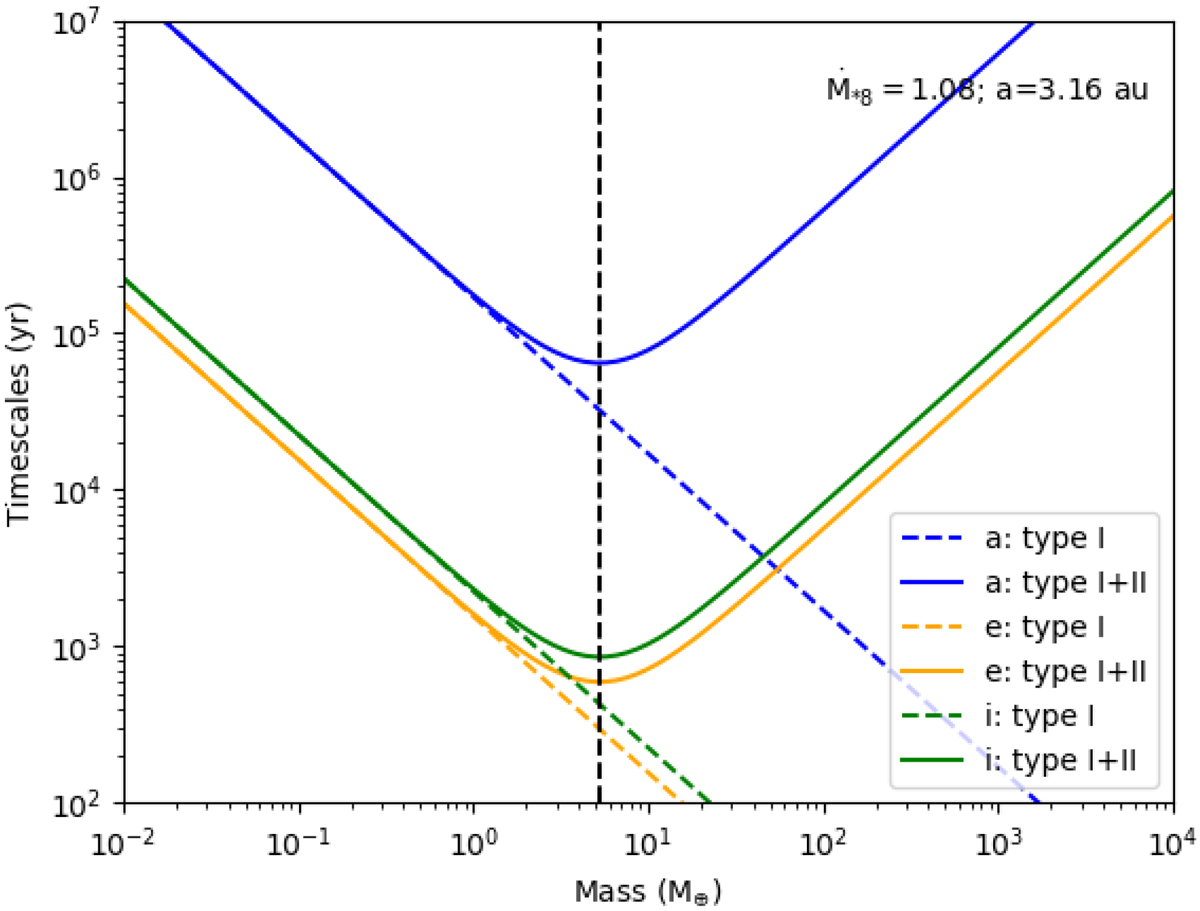
Comparison of evolution timescales of semi-major axis τa (blue), eccentricity τe (orange), and inclination τi (green) for a planet at 3.16 au with the circular and coplanar orbit in Disc 6. Solid and dashed blue lines are from Eqs. (8) and (3), respectively. The vertical black dashed line indicates where migration timescale takes the minimum value (Eq. (10)).
Current usage metrics show cumulative count of Article Views (full-text article views including HTML views, PDF and ePub downloads, according to the available data) and Abstracts Views on Vision4Press platform.
Data correspond to usage on the plateform after 2015. The current usage metrics is available 48-96 hours after online publication and is updated daily on week days.
Initial download of the metrics may take a while.