Fig. B.3.
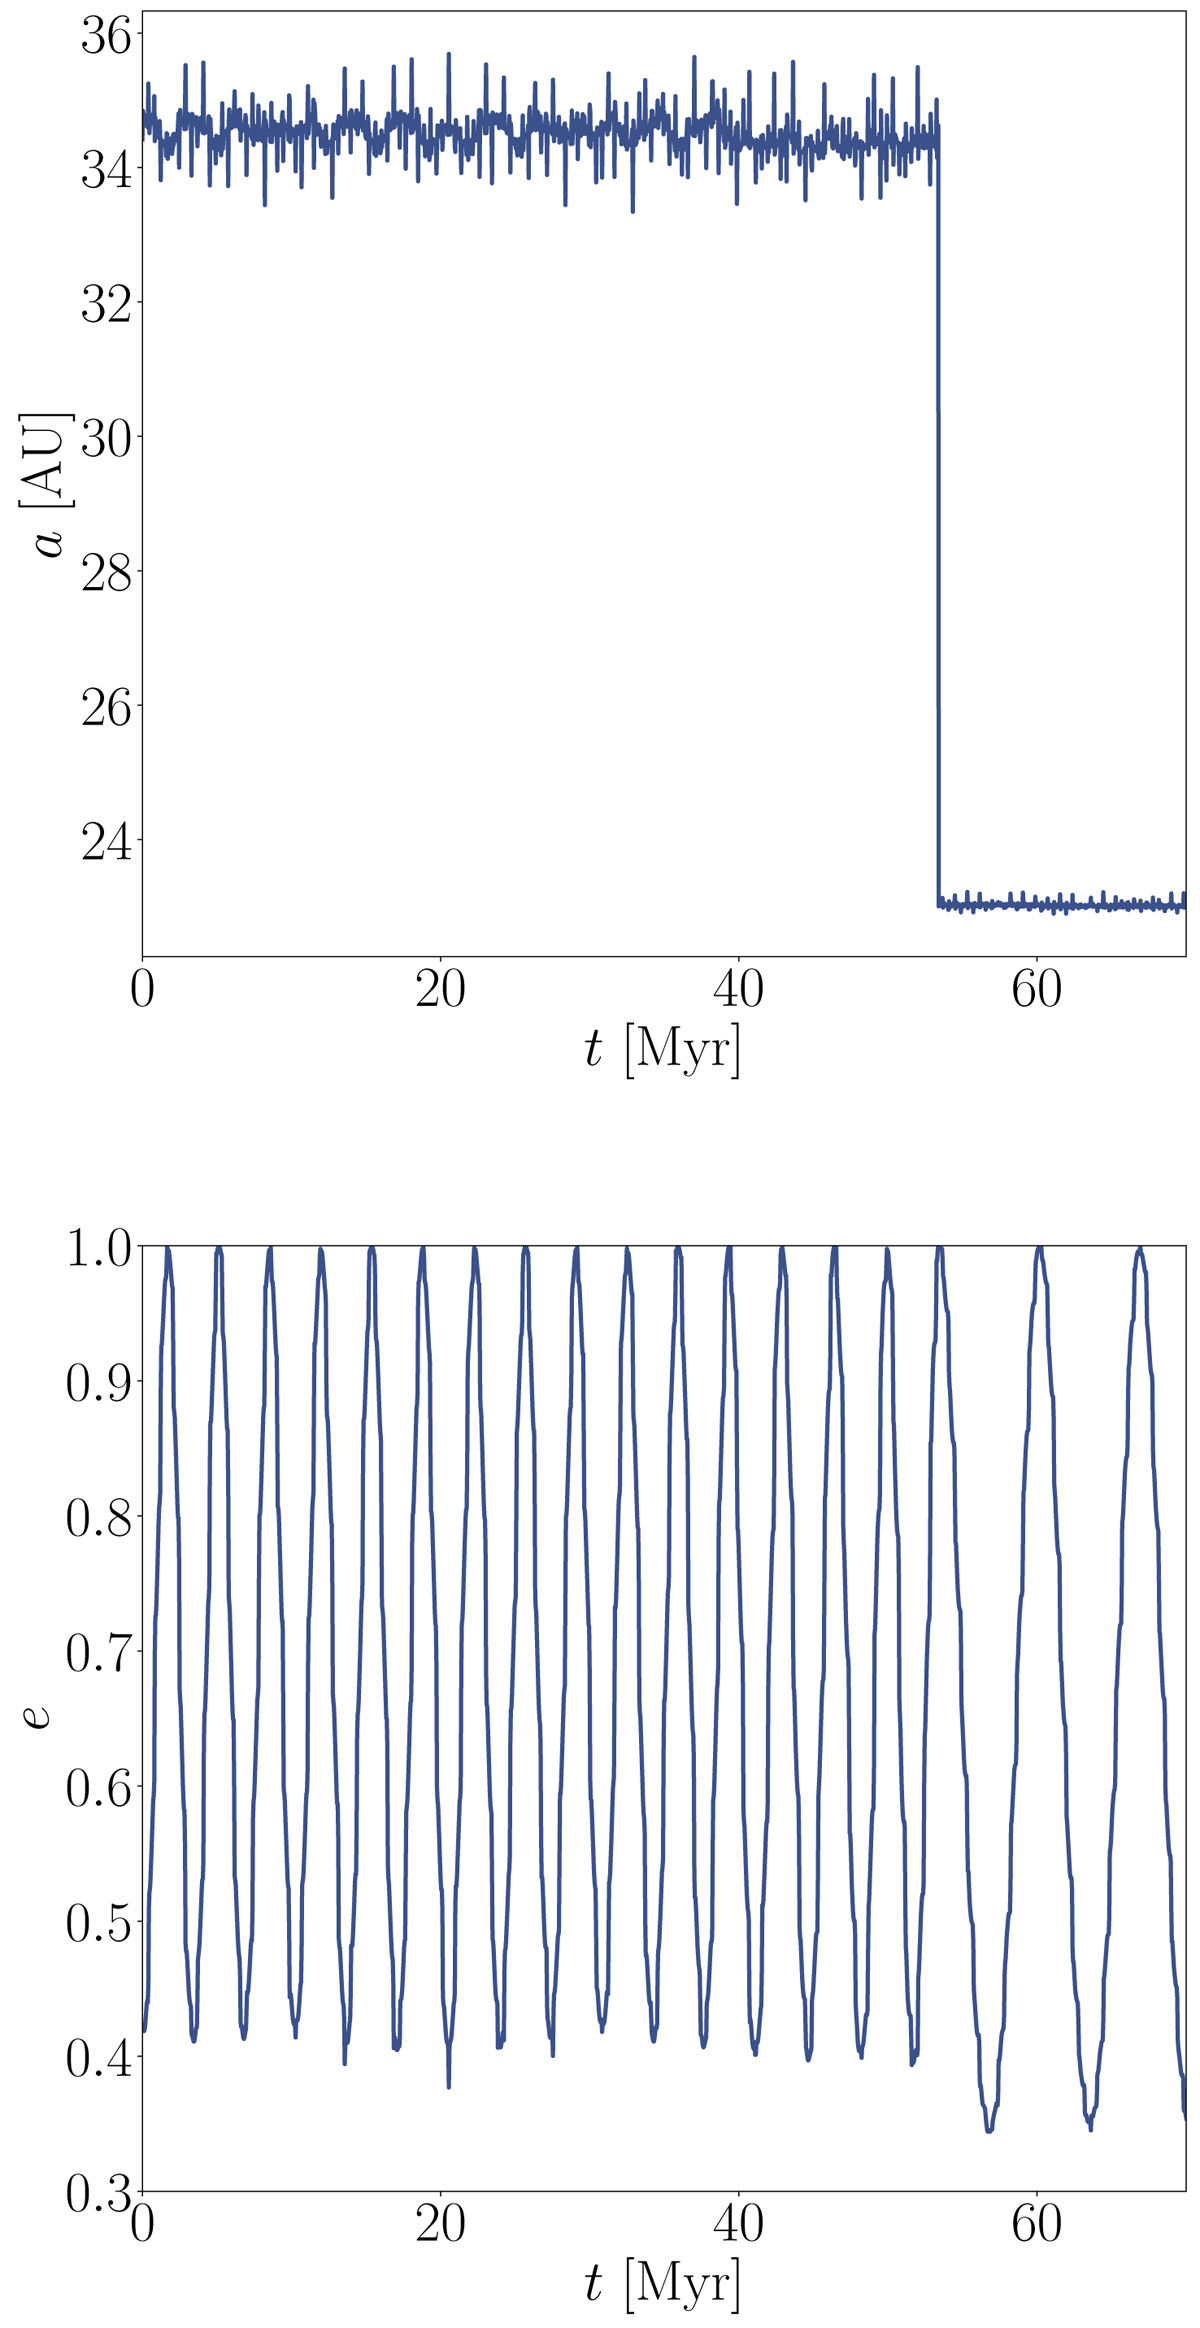
Top panel: time evolution of a in simulation No. 593 in SET4. Bottom panel: same as in top panel, but here the eccentricity is represented. We note the moment at which the shrinking efficiency peaks at ∼0.05 Myr, after which the semi-major axis drops, the minimum eccentricity decreases, and the eccentricity variation period increases until the merger occurs at 0.07 Myr.
Current usage metrics show cumulative count of Article Views (full-text article views including HTML views, PDF and ePub downloads, according to the available data) and Abstracts Views on Vision4Press platform.
Data correspond to usage on the plateform after 2015. The current usage metrics is available 48-96 hours after online publication and is updated daily on week days.
Initial download of the metrics may take a while.