Free Access
Fig. A.4.
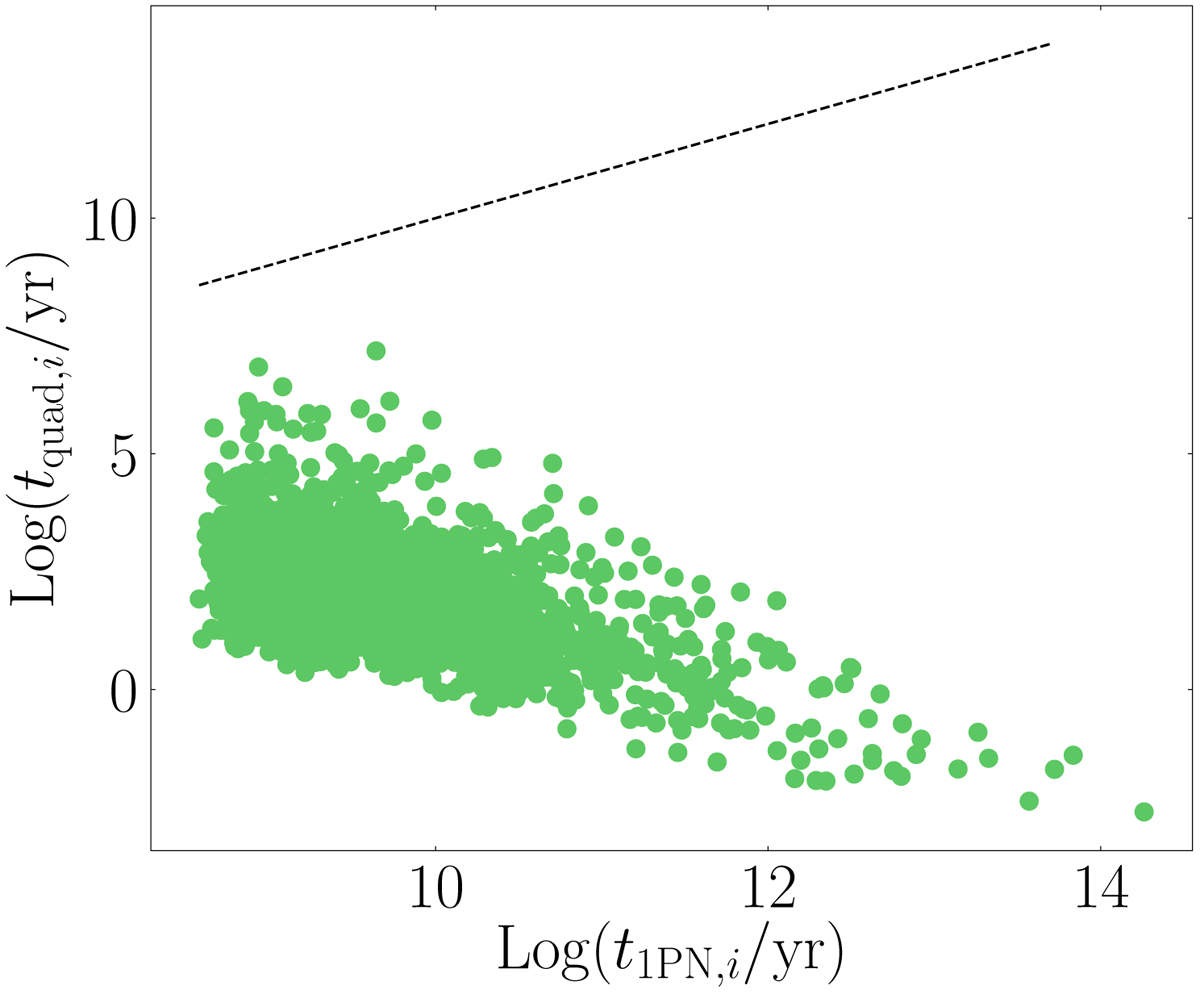
Initial value of the precession time due to GR according to 1PN terms (y-axis) compared with the quadrupole timescale (x-axis) for all models in SET4. The dotted line represents the locus of points having x = y.
Current usage metrics show cumulative count of Article Views (full-text article views including HTML views, PDF and ePub downloads, according to the available data) and Abstracts Views on Vision4Press platform.
Data correspond to usage on the plateform after 2015. The current usage metrics is available 48-96 hours after online publication and is updated daily on week days.
Initial download of the metrics may take a while.