Fig. 3.
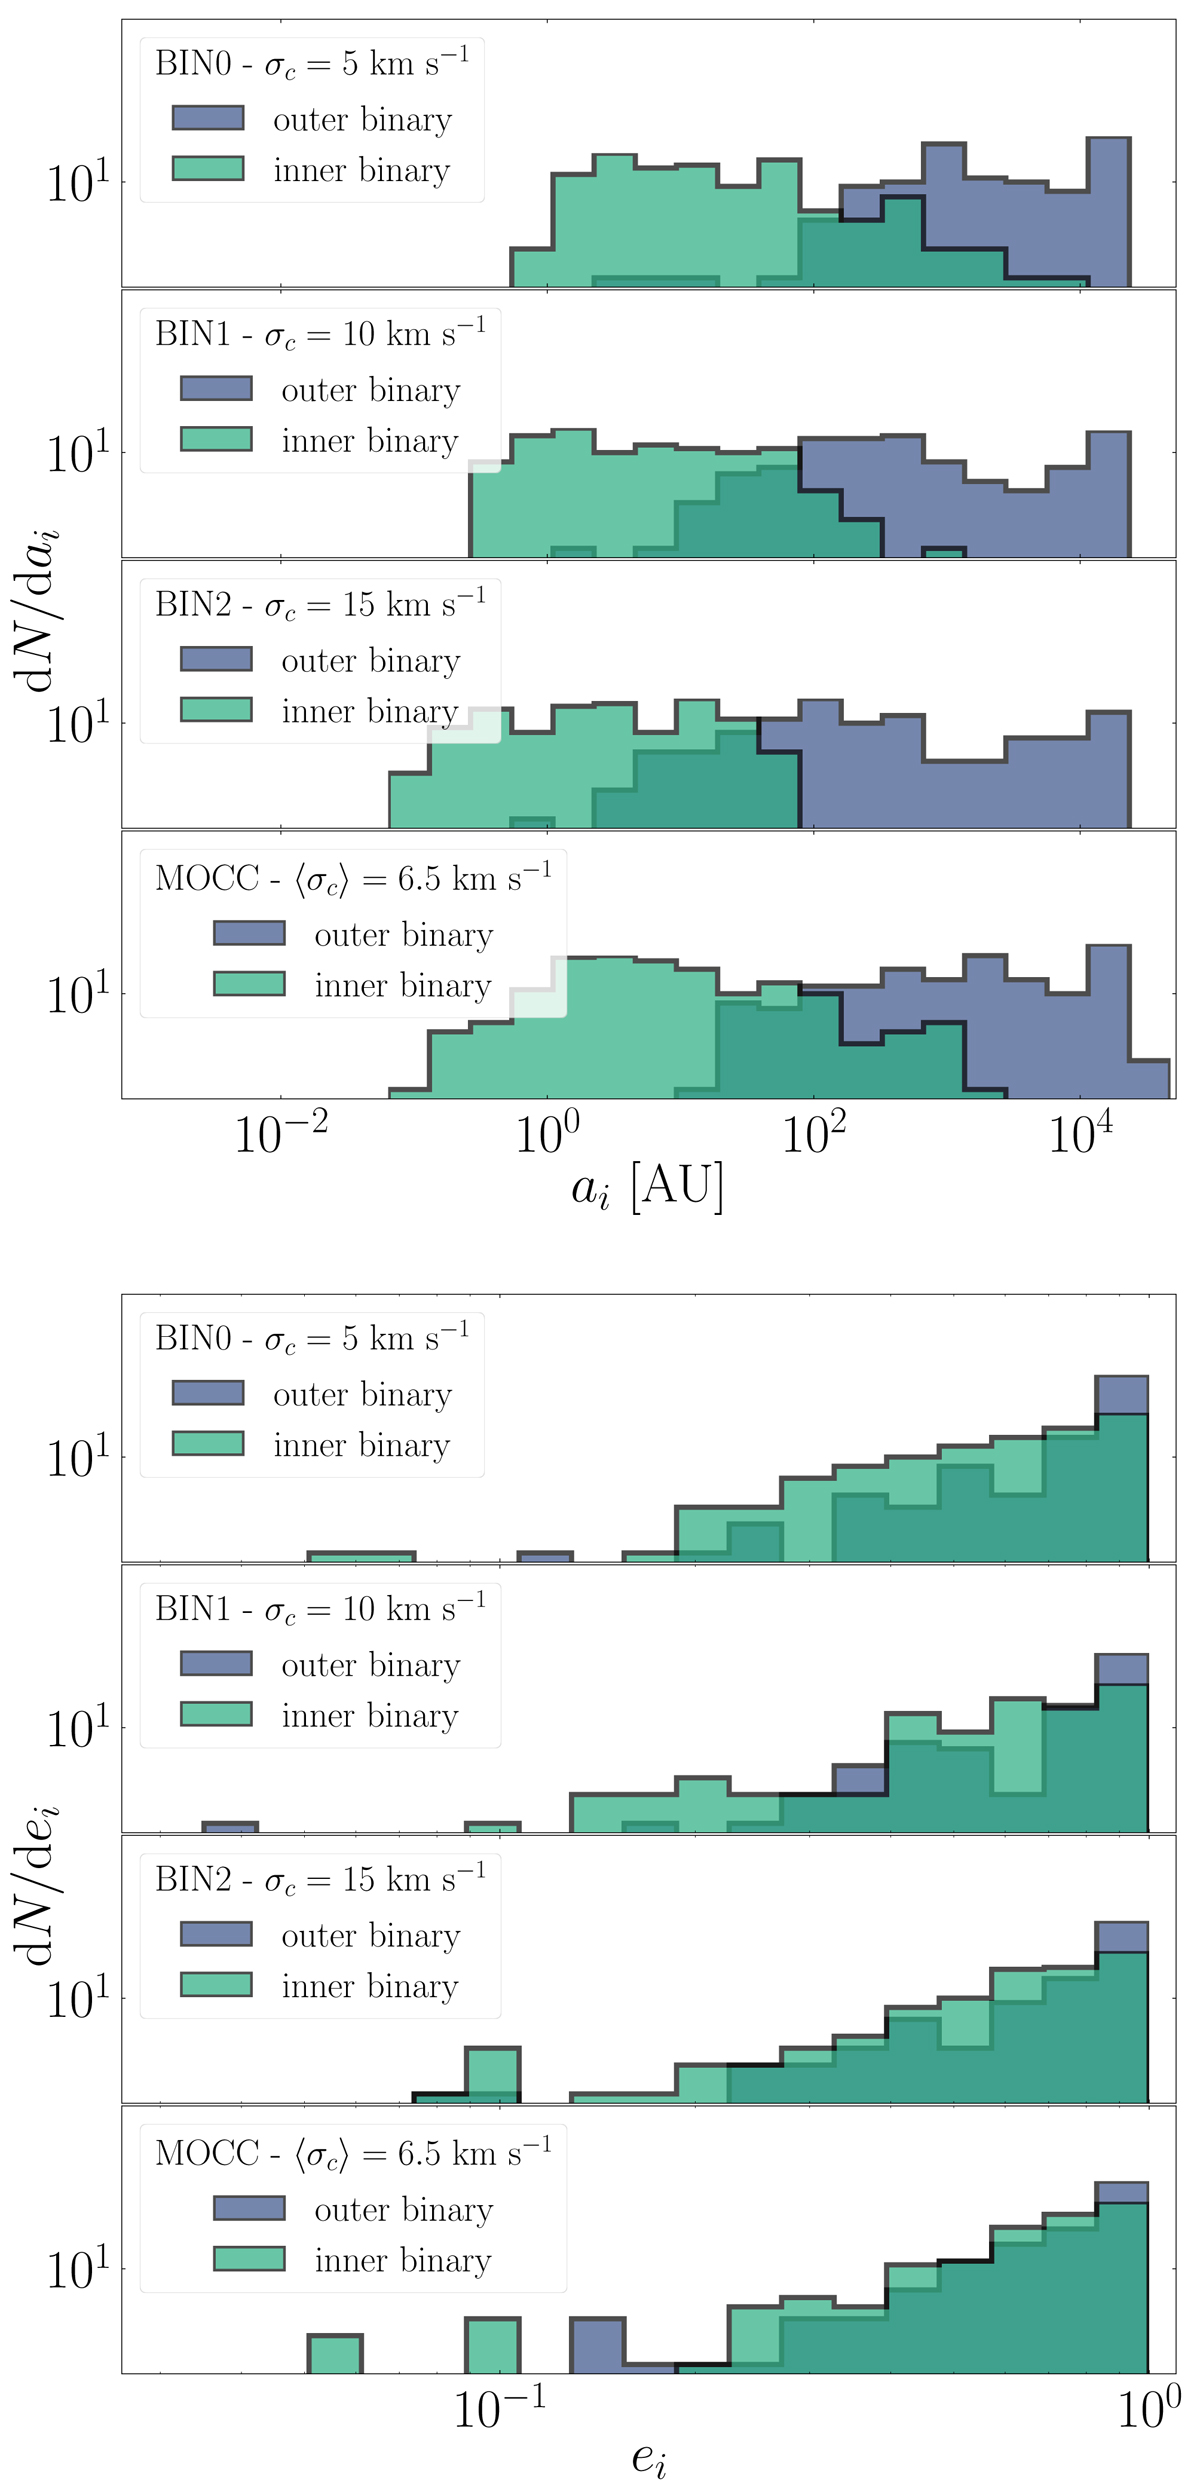
Top figure: distribution of semi-major axis for the resulting outer (filled blue steps) and inner binaries (filled green steps) following the binary–binary scatterings. Bottom figure: eccentricity distribution of the outer and inner binary, using the same colour-coding as in the top figure. In both figures, panels from top to bottom refer to cluster velocity dispersion values σc = 5 − 10 − 15 km s−1, respectively.
Current usage metrics show cumulative count of Article Views (full-text article views including HTML views, PDF and ePub downloads, according to the available data) and Abstracts Views on Vision4Press platform.
Data correspond to usage on the plateform after 2015. The current usage metrics is available 48-96 hours after online publication and is updated daily on week days.
Initial download of the metrics may take a while.