Free Access
Fig. 25.
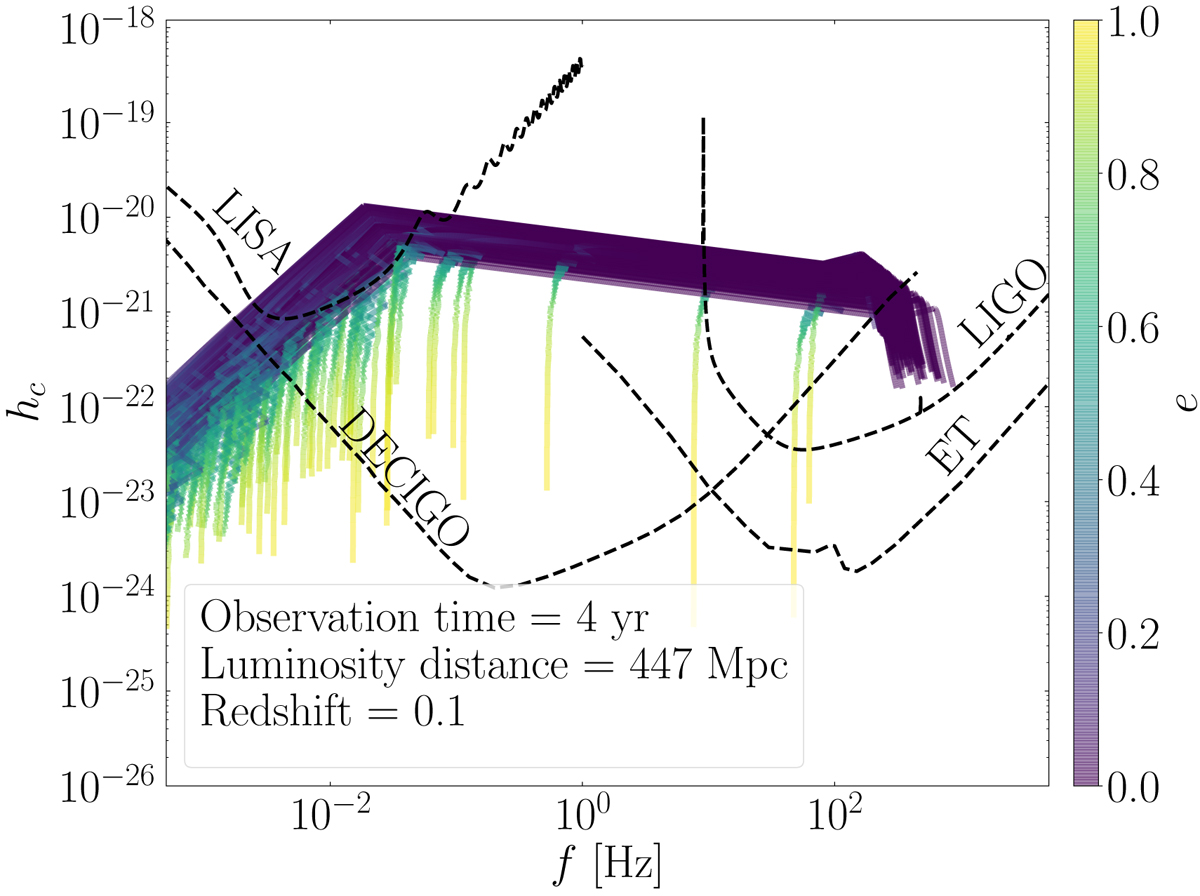
Characteristic strain amplitude evolution for the dominant frequency of 150 merging BHBs in SET10 compared with the sensitivity curves for LISA, KAGRA, LIGO, DECIGO and the Einstein Telescope GW observatories. The coloured map identifies BHB eccentricity.
Current usage metrics show cumulative count of Article Views (full-text article views including HTML views, PDF and ePub downloads, according to the available data) and Abstracts Views on Vision4Press platform.
Data correspond to usage on the plateform after 2015. The current usage metrics is available 48-96 hours after online publication and is updated daily on week days.
Initial download of the metrics may take a while.