Fig. 6.
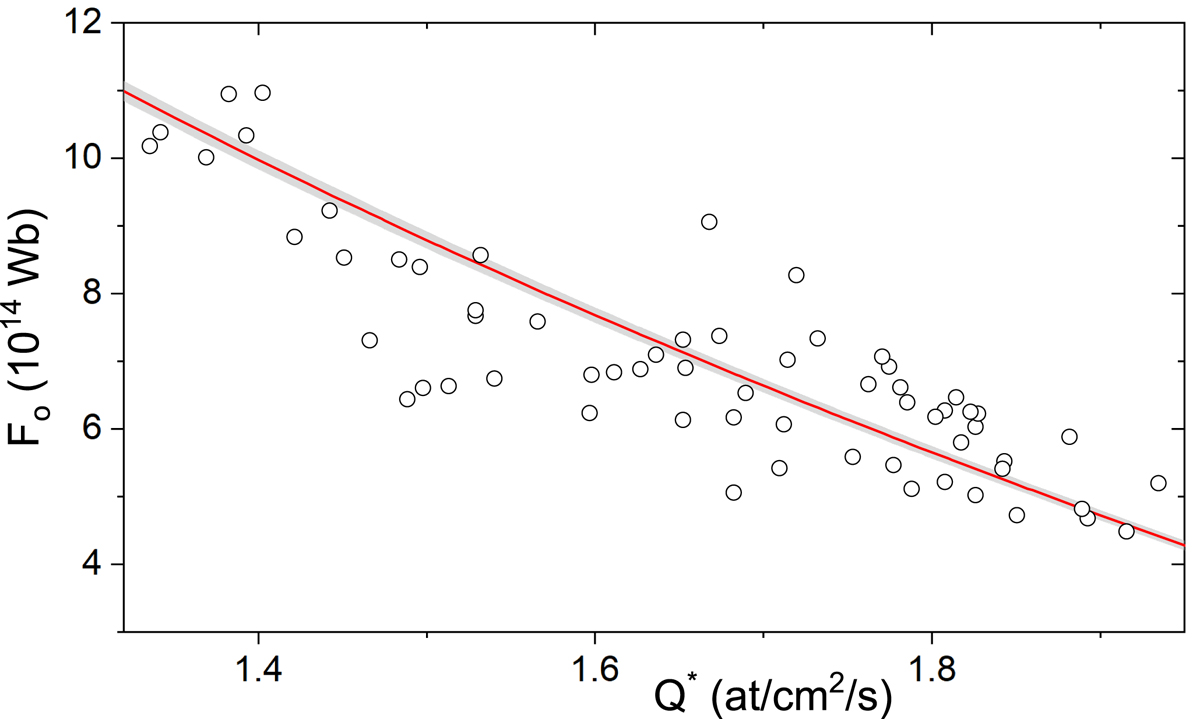
Scatter plot of the annual solar open magnetic flux Fo (Lockwood et al. 2009; Owens et al. 2017) against the 14C production rate Q* estimated from NMs (see Fig. 5). The red curve depicts the best-fit dependence (Eq. (6)).
Current usage metrics show cumulative count of Article Views (full-text article views including HTML views, PDF and ePub downloads, according to the available data) and Abstracts Views on Vision4Press platform.
Data correspond to usage on the plateform after 2015. The current usage metrics is available 48-96 hours after online publication and is updated daily on week days.
Initial download of the metrics may take a while.