Fig. 5.
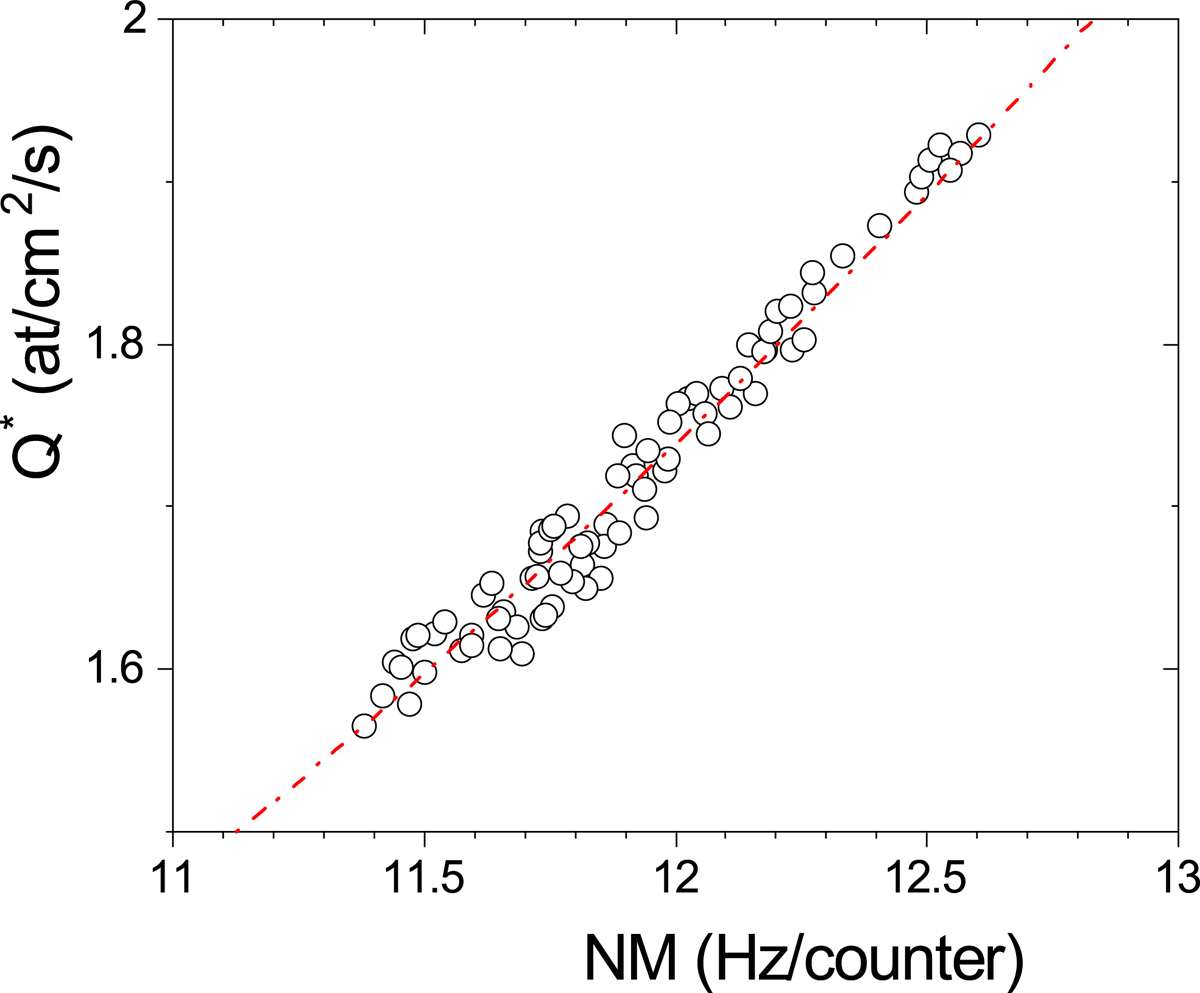
Scatter plot of the 14C global production rate Q*, computed based on the AMS-02 data for the period 2011–2017, and a polar NM64 (Oulu) neutron monitor count rate for the same period, with the dot-dashed red line depicting the dependence (Eq. (5)).
Current usage metrics show cumulative count of Article Views (full-text article views including HTML views, PDF and ePub downloads, according to the available data) and Abstracts Views on Vision4Press platform.
Data correspond to usage on the plateform after 2015. The current usage metrics is available 48-96 hours after online publication and is updated daily on week days.
Initial download of the metrics may take a while.