Fig. 13.
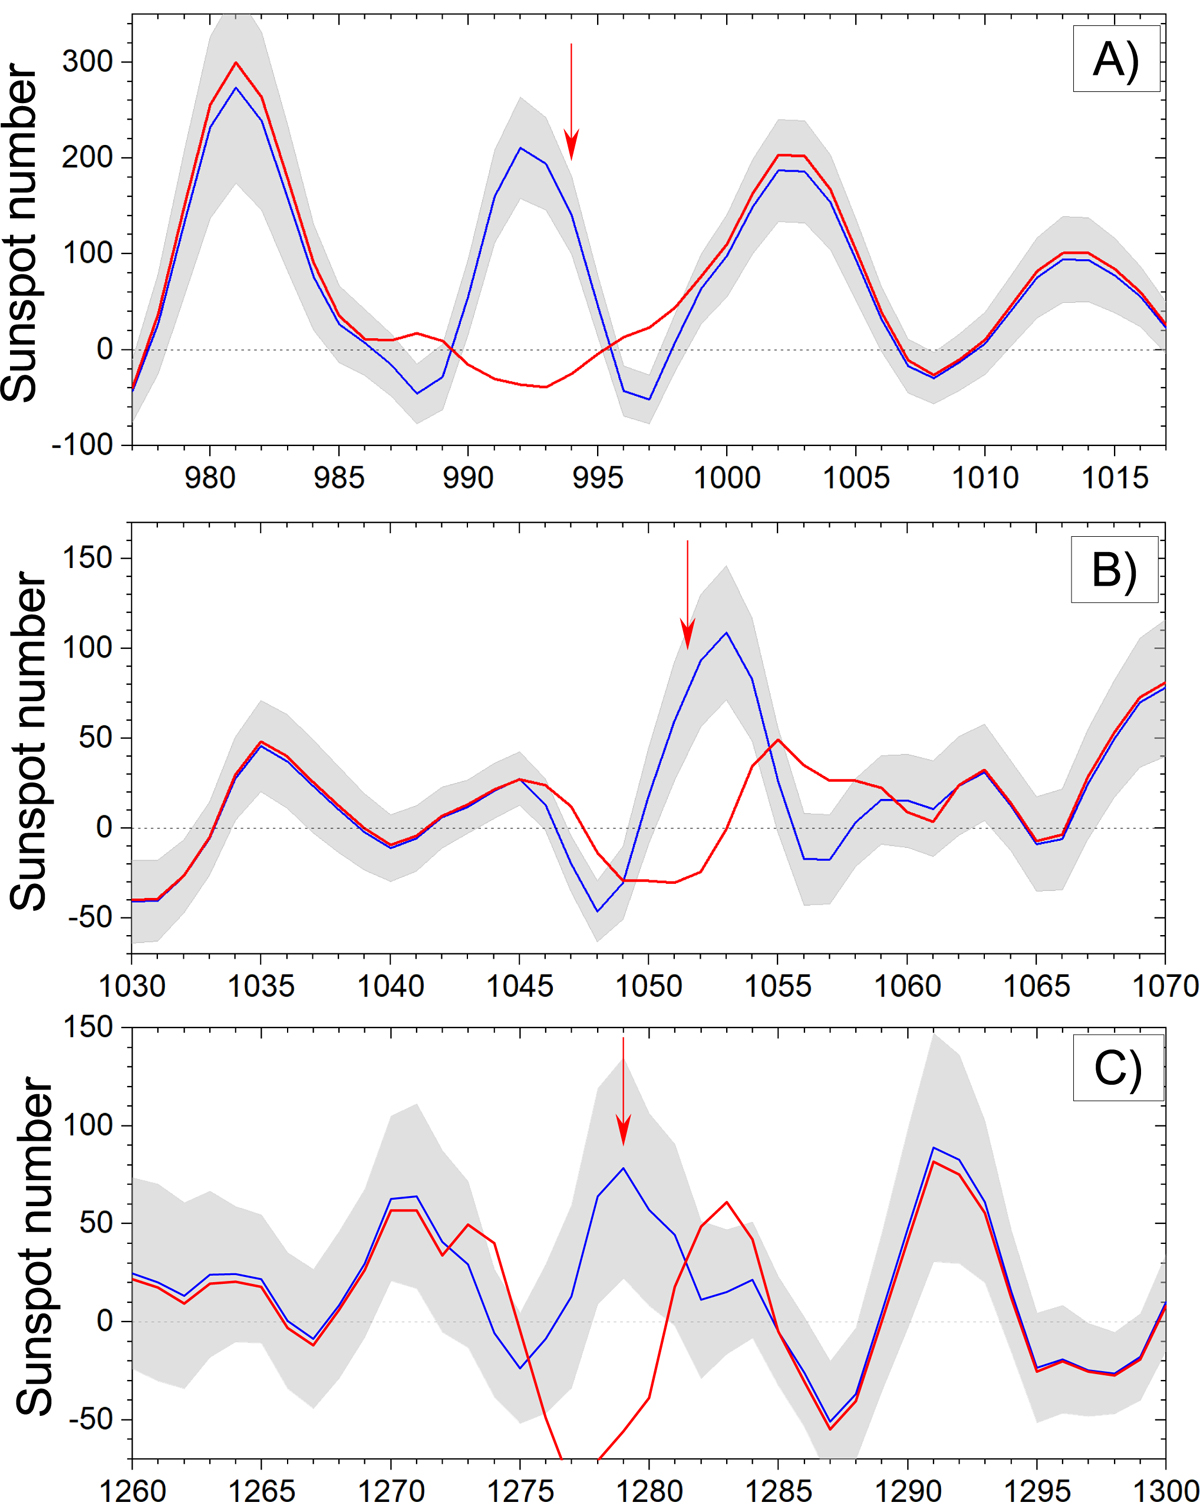
Evolution of the reconstructed SNs (blue curve with ±1σ grey-shaded uncertainties) for the periods around the corrected events: 994 AD (panel A), 1052 AD (panel B), and 1279 (panel C). The red curve depicts SNs if no correction is applied. Red arrows indicate the time of the events.
Current usage metrics show cumulative count of Article Views (full-text article views including HTML views, PDF and ePub downloads, according to the available data) and Abstracts Views on Vision4Press platform.
Data correspond to usage on the plateform after 2015. The current usage metrics is available 48-96 hours after online publication and is updated daily on week days.
Initial download of the metrics may take a while.