Fig. 1.
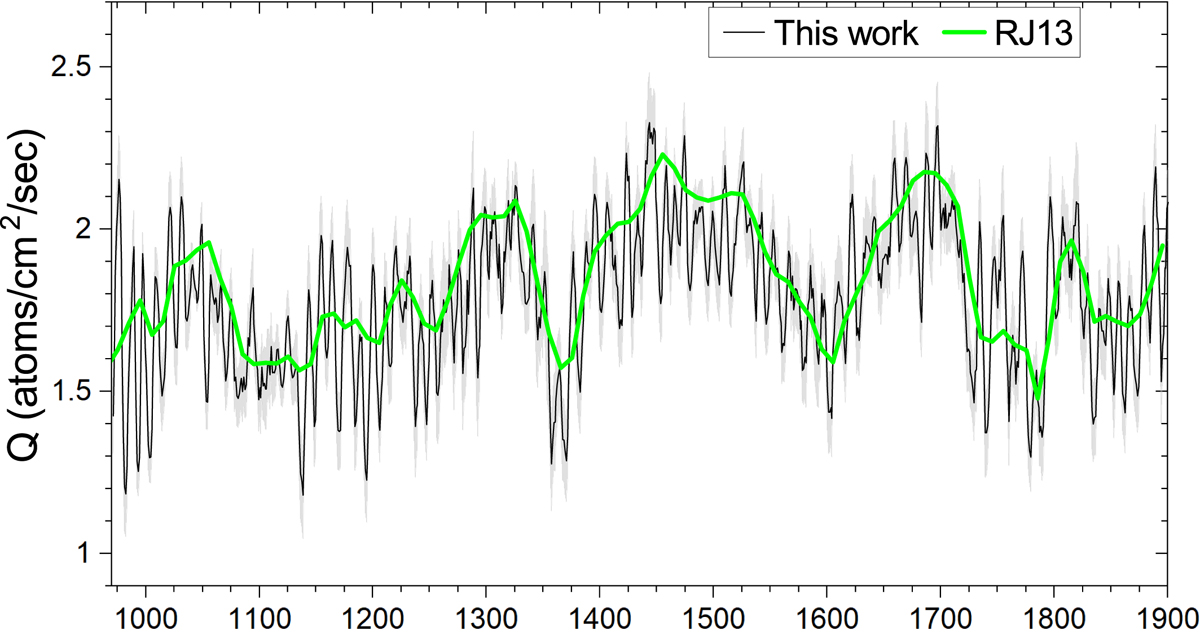
14C production rate Q (black curve) with 1σ uncertainties, obtained from Brehm et al. (2021), used here after corrections for the 994, 1052, and 1279 AD events and smoothing (see Sect. 2). The green RJ13 curve depicts Q from Roth & Joos (2013).
Current usage metrics show cumulative count of Article Views (full-text article views including HTML views, PDF and ePub downloads, according to the available data) and Abstracts Views on Vision4Press platform.
Data correspond to usage on the plateform after 2015. The current usage metrics is available 48-96 hours after online publication and is updated daily on week days.
Initial download of the metrics may take a while.