Fig. B.5
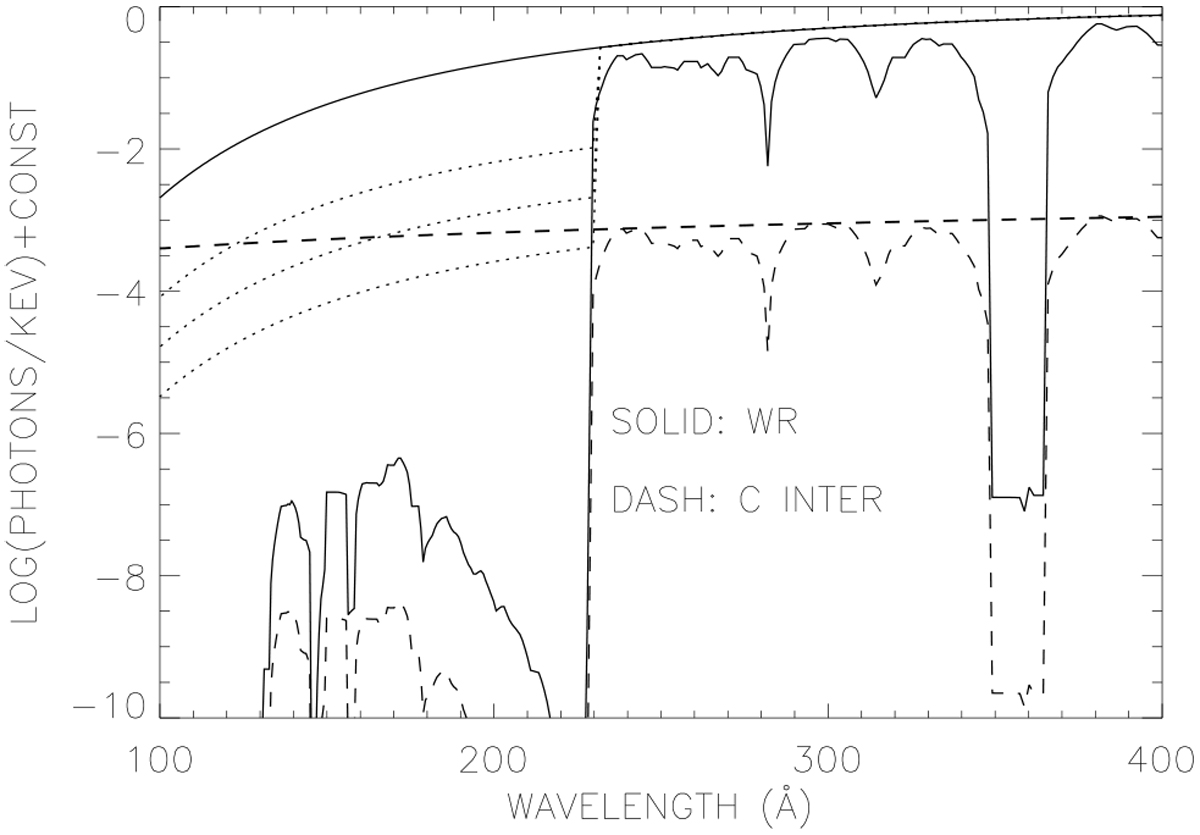
Spectral energy distributions for the radiators of the intermediate spectral state at Φ = 0 (along the line joining the centers of components). Solid lines show the WR spectra at the photosphere (125 000 K blackbody) and the absorbed spectra at distance 2 RWR from the WR surface. The dashed lines show the compact star spectra (unabsorbed and absorbed at distance 0.1 RWR from the WR surface). The dotted lines show some partially cut blackbodies used to compute force multiplier grids.
Current usage metrics show cumulative count of Article Views (full-text article views including HTML views, PDF and ePub downloads, according to the available data) and Abstracts Views on Vision4Press platform.
Data correspond to usage on the plateform after 2015. The current usage metrics is available 48-96 hours after online publication and is updated daily on week days.
Initial download of the metrics may take a while.