Open Access
Fig. 6.
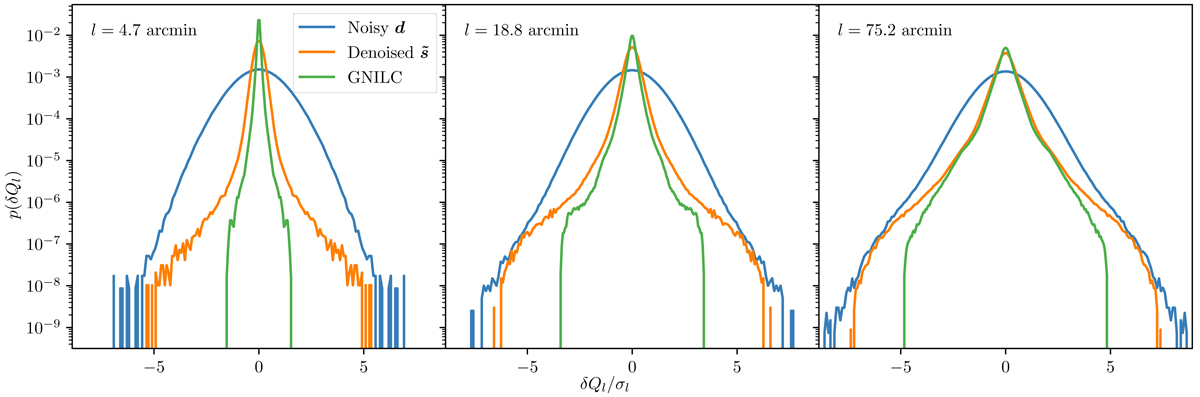
PDFs of the Chamaeleon-Musca Q maps increments for d (noisy), ![]() (denoised), and GNILC map, computed for three logarithmically spaced lags ranging from 4.7′ to 75.2′. For each lag, the increments were normalized by the standard deviation σl of the Gaussian that fits the core of the PDF of the noisy map.
(denoised), and GNILC map, computed for three logarithmically spaced lags ranging from 4.7′ to 75.2′. For each lag, the increments were normalized by the standard deviation σl of the Gaussian that fits the core of the PDF of the noisy map.
Current usage metrics show cumulative count of Article Views (full-text article views including HTML views, PDF and ePub downloads, according to the available data) and Abstracts Views on Vision4Press platform.
Data correspond to usage on the plateform after 2015. The current usage metrics is available 48-96 hours after online publication and is updated daily on week days.
Initial download of the metrics may take a while.