Open Access
Fig. 5.
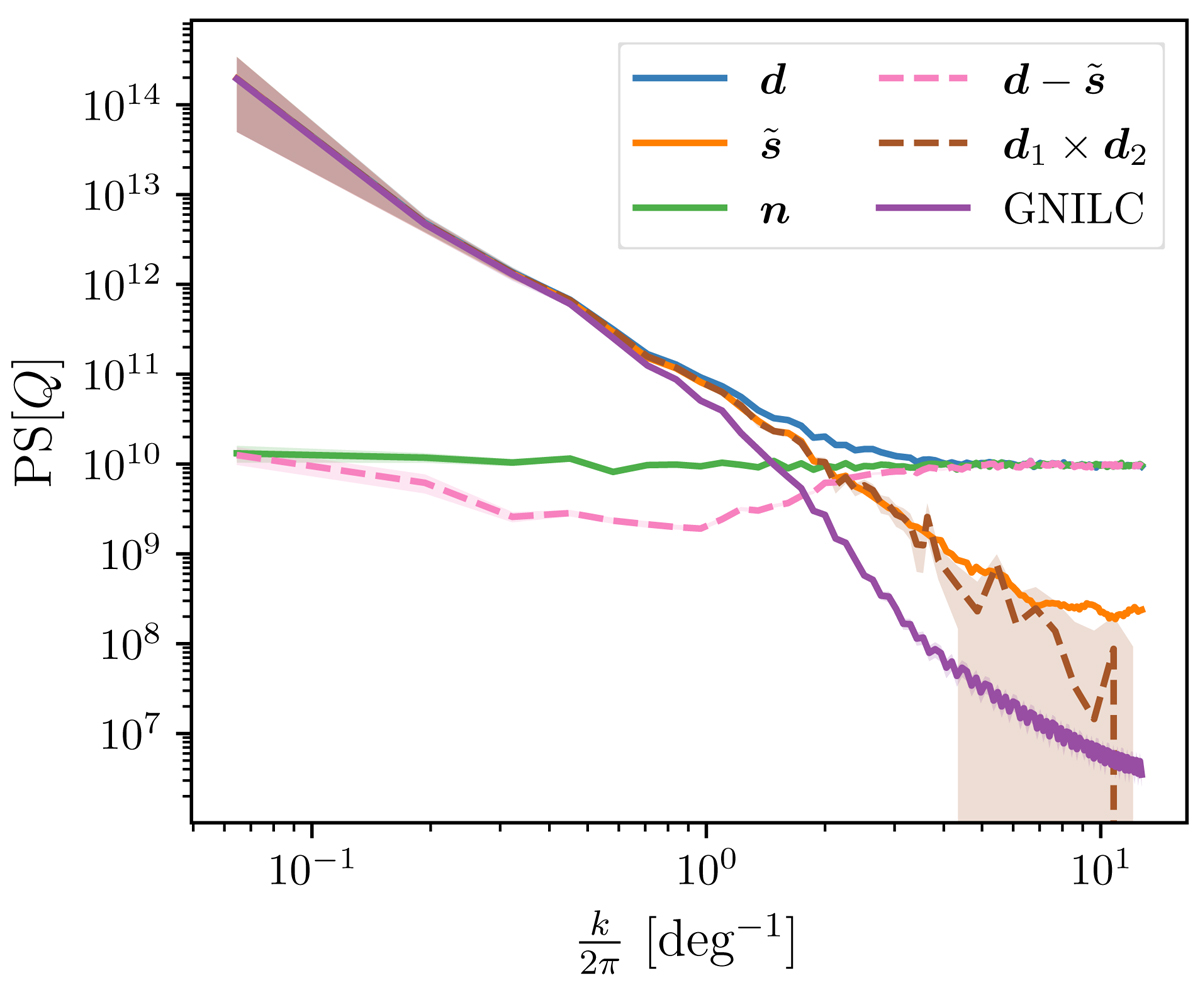
Q maps power spectra for d, ![]() , n (all in solid lines), and
, n (all in solid lines), and ![]() , and cross-spectrum between d1 and d2 (both in dashed lines). This cross-spectrum estimates the power spectrum of the dust emission. Also shown in a solid line is the power spectrum of the GNILC Q map, corresponding to the same Chamaeleon-Musca field.
, and cross-spectrum between d1 and d2 (both in dashed lines). This cross-spectrum estimates the power spectrum of the dust emission. Also shown in a solid line is the power spectrum of the GNILC Q map, corresponding to the same Chamaeleon-Musca field.
Current usage metrics show cumulative count of Article Views (full-text article views including HTML views, PDF and ePub downloads, according to the available data) and Abstracts Views on Vision4Press platform.
Data correspond to usage on the plateform after 2015. The current usage metrics is available 48-96 hours after online publication and is updated daily on week days.
Initial download of the metrics may take a while.