Open Access
Fig. 4.
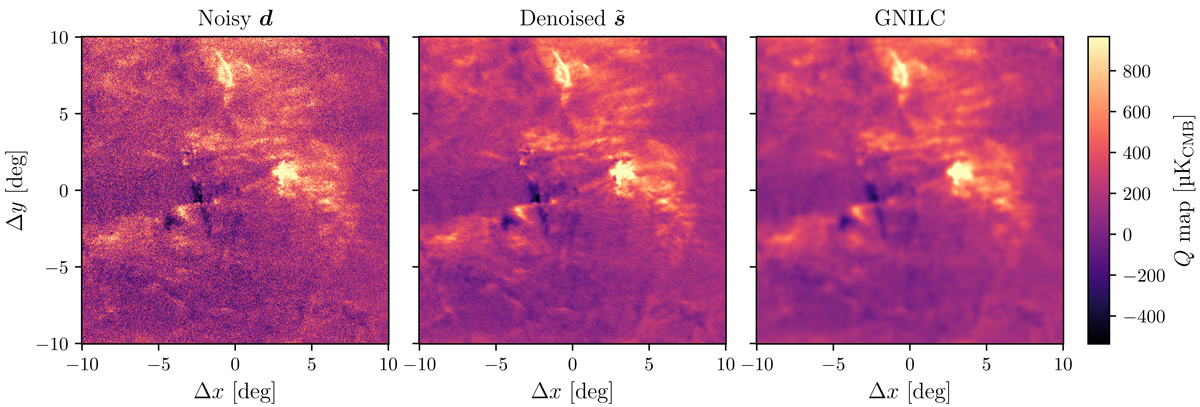
Noisy (left) and denoised (middle) Q maps of the Chamaeleon-Musca region as observed by the Planck satellite at 353 GHz. The noisy maps were denoised as described in Sect. 2.1. We also show the corresponding GNILC map (right) for reference.
Current usage metrics show cumulative count of Article Views (full-text article views including HTML views, PDF and ePub downloads, according to the available data) and Abstracts Views on Vision4Press platform.
Data correspond to usage on the plateform after 2015. The current usage metrics is available 48-96 hours after online publication and is updated daily on week days.
Initial download of the metrics may take a while.