Fig. 9.
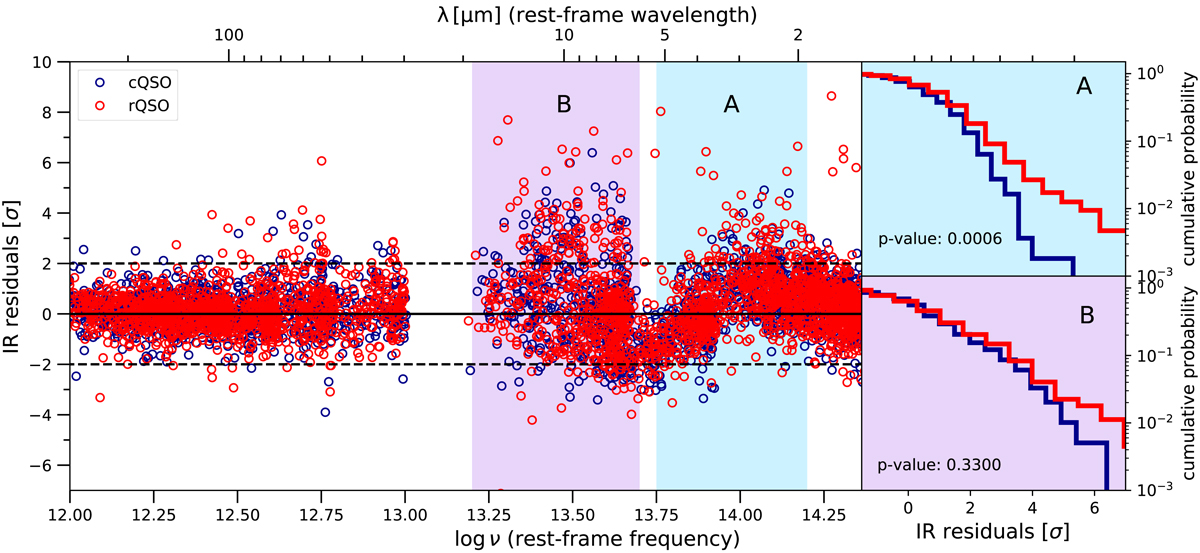
Residuals from the best fits for each source as a function of rest-frame frequency. Two small ‘bumps’ are identified in the MIR regime, where the torus models included in our model show the largest discrepancy with the data. The main discrepancies have positive residuals meaning the model cannot reproduce a part of the flux at these frequencies. Right panels: cumulative distributions of the incidence of residuals in each sample. We investigate whether these residuals are connected to the optical colour of the QSO, despite the fact these bands are independent in the fitting. We find that red QSOs have larger MIR emission excess compared to the model in the regime of 13.75 < log ν < 14.2 (2−5 μm), showing significant residuals ( > 2σ) in 20% of the cases, in contrast to the 10% in the case of control QSOs.
Current usage metrics show cumulative count of Article Views (full-text article views including HTML views, PDF and ePub downloads, according to the available data) and Abstracts Views on Vision4Press platform.
Data correspond to usage on the plateform after 2015. The current usage metrics is available 48-96 hours after online publication and is updated daily on week days.
Initial download of the metrics may take a while.