Fig. 5.
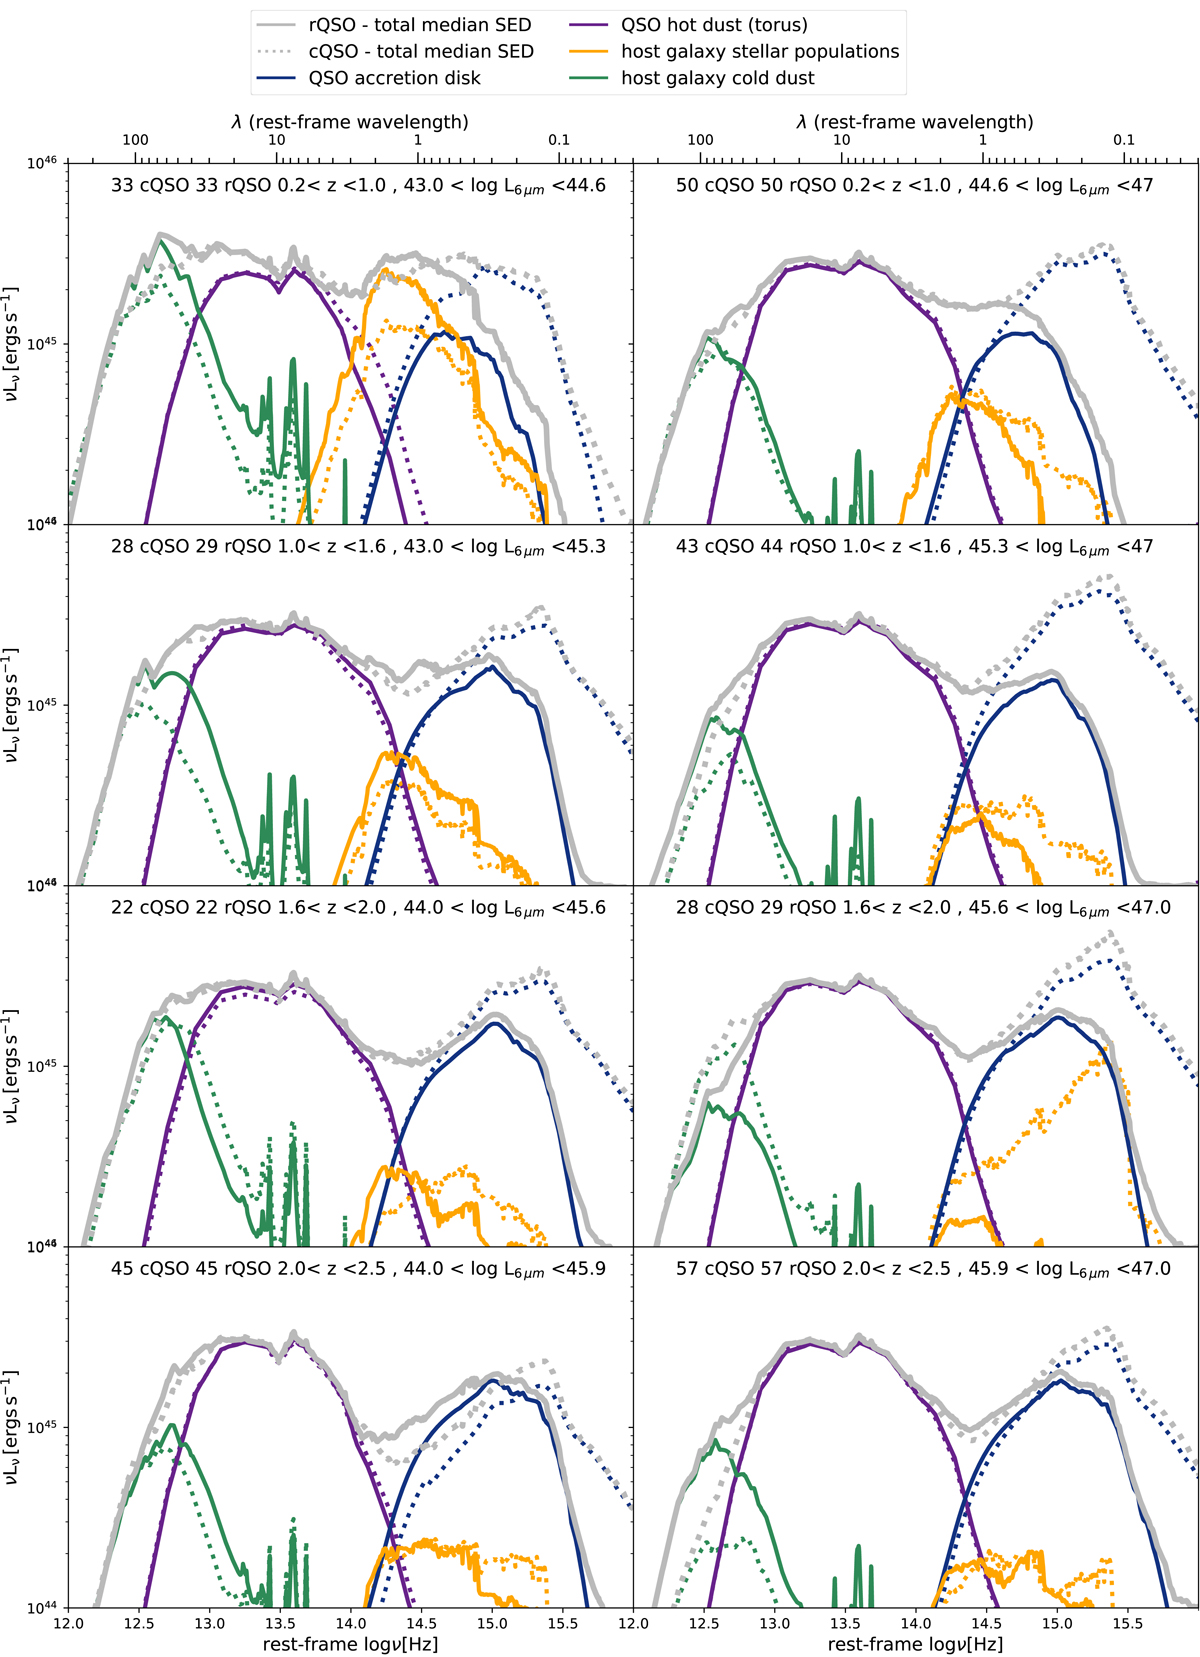
Median composite SEDs are shown for the red QSO sample (solid lines of different colours) and matched control QSO samples (dotted lines of different colours), now split into different bins of L6 μm (left-right) and z (top-bottom). All composite SEDs have been renormalised to the same L6 μm for purposes of visualisation. The grey solid and dotted lines represent the total SEDs for the red and control samples, respectively. The remaining colours codify the different physical components as described in the legend of Fig. 3. The luminosity and redshift bins considered and the number of sources included in each bin are annotated. The contribution of the stellar emission of the host galaxies has a clear contribution to the total SEDs in the lower redshift bins and to luminosities of L6 μm < 45. A remarkable similarity in the composite torus SEDs of red and control QSOs across all redshift bins can be seen.
Current usage metrics show cumulative count of Article Views (full-text article views including HTML views, PDF and ePub downloads, according to the available data) and Abstracts Views on Vision4Press platform.
Data correspond to usage on the plateform after 2015. The current usage metrics is available 48-96 hours after online publication and is updated daily on week days.
Initial download of the metrics may take a while.