Fig. 2.
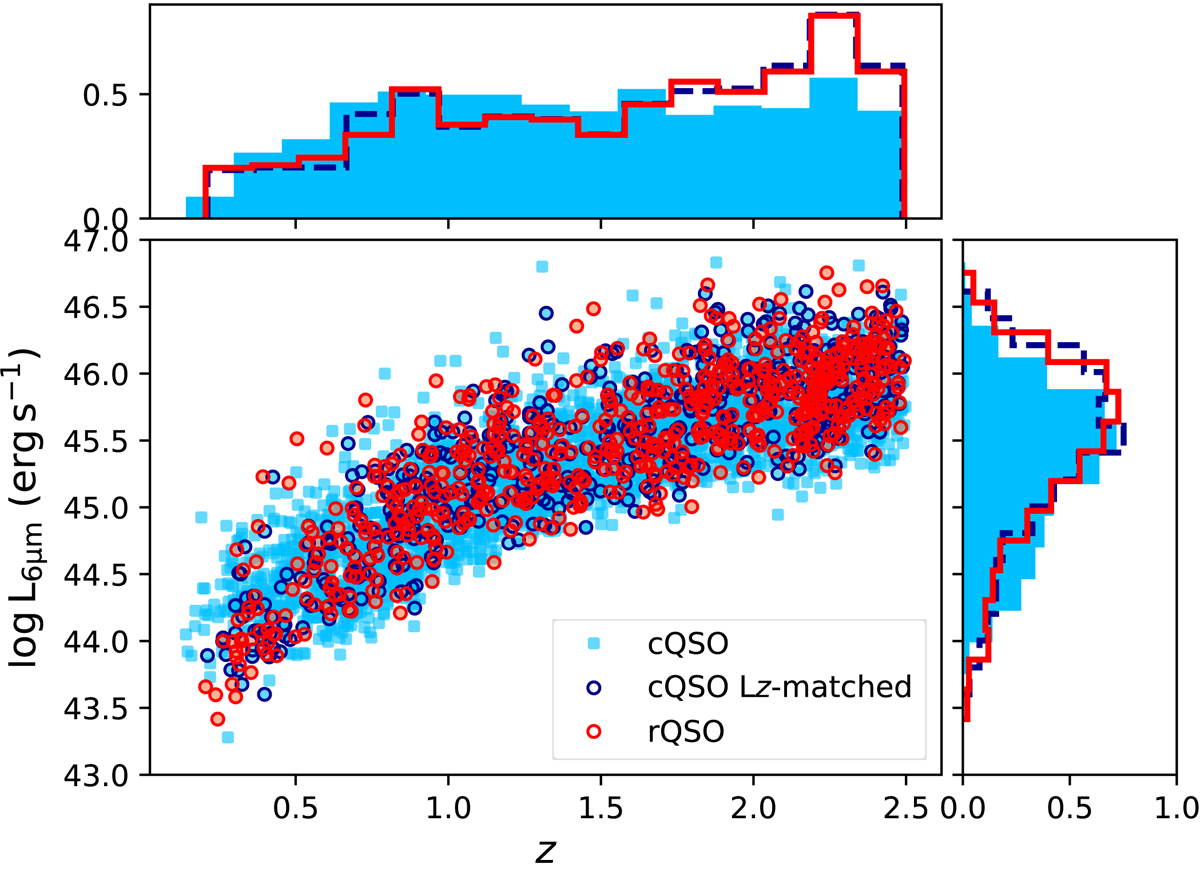
Monochromatic 6 μm luminosities (L6 μm) of red QSOs (red filled circles), control QSOs (sky-blue filled circles) and Lz-matched control QSOs (dark-blue circles) as a function of redshift are plotted in the central panel. Side panels show normalised histograms of the L6 μm and redshift distributions for each population, shown as solid lines (red QSO), dashed lines (L − z matched samples) and shaded areas (entire control sample) of respective colours. By comparing the distributions of the red QSOs and the Lz-matched control QSO sample, it can be clearly seen that equivalent QSO properties are being sampled.
Current usage metrics show cumulative count of Article Views (full-text article views including HTML views, PDF and ePub downloads, according to the available data) and Abstracts Views on Vision4Press platform.
Data correspond to usage on the plateform after 2015. The current usage metrics is available 48-96 hours after online publication and is updated daily on week days.
Initial download of the metrics may take a while.