Fig. 13.
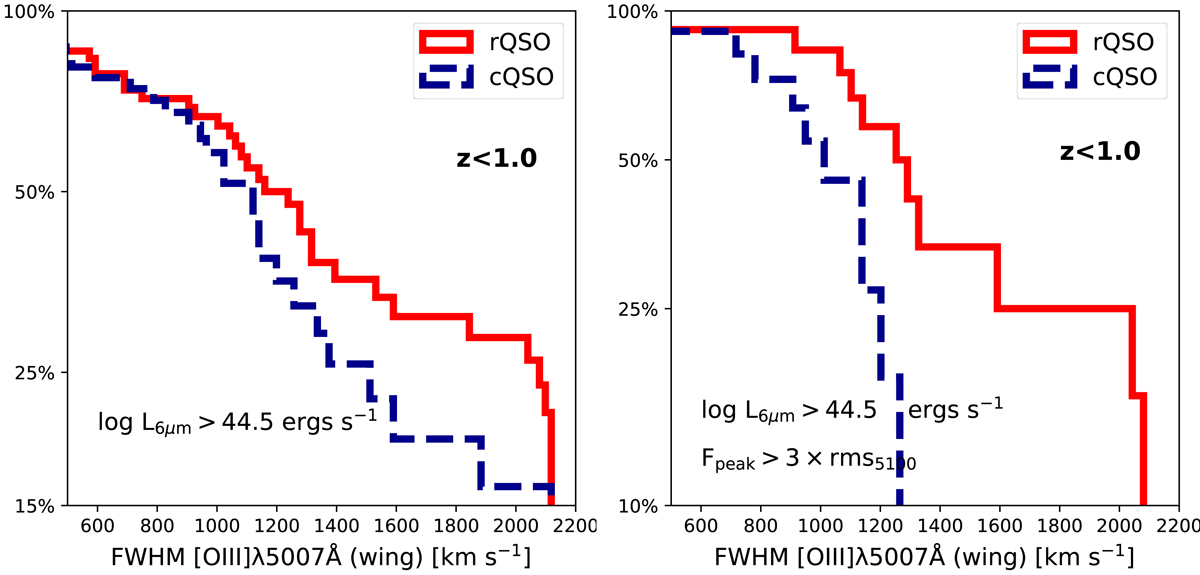
Cumulative distributions of the FWHMs (in the units of km s−1) of the wing component of the [O III]λ5007 emission line for the red and control QSOs. Two cuts were required from our parent sample due to observability of the [O III] line (z < 1) and to avoid contamination from the host galaxy (log L6 μm > 44.5). Left panel: entire population, without any further quality requirement. Right panel: we restrict our study to high quality detections of the wing components, based on a SNR criterion defined in the plot, which is consistent with our visual inspection of the lines. The high-quality detection cut increases the evidence for a prevalence of high velocity winds in red QSOs as compared to control QSOs.
Current usage metrics show cumulative count of Article Views (full-text article views including HTML views, PDF and ePub downloads, according to the available data) and Abstracts Views on Vision4Press platform.
Data correspond to usage on the plateform after 2015. The current usage metrics is available 48-96 hours after online publication and is updated daily on week days.
Initial download of the metrics may take a while.