Fig. 12.
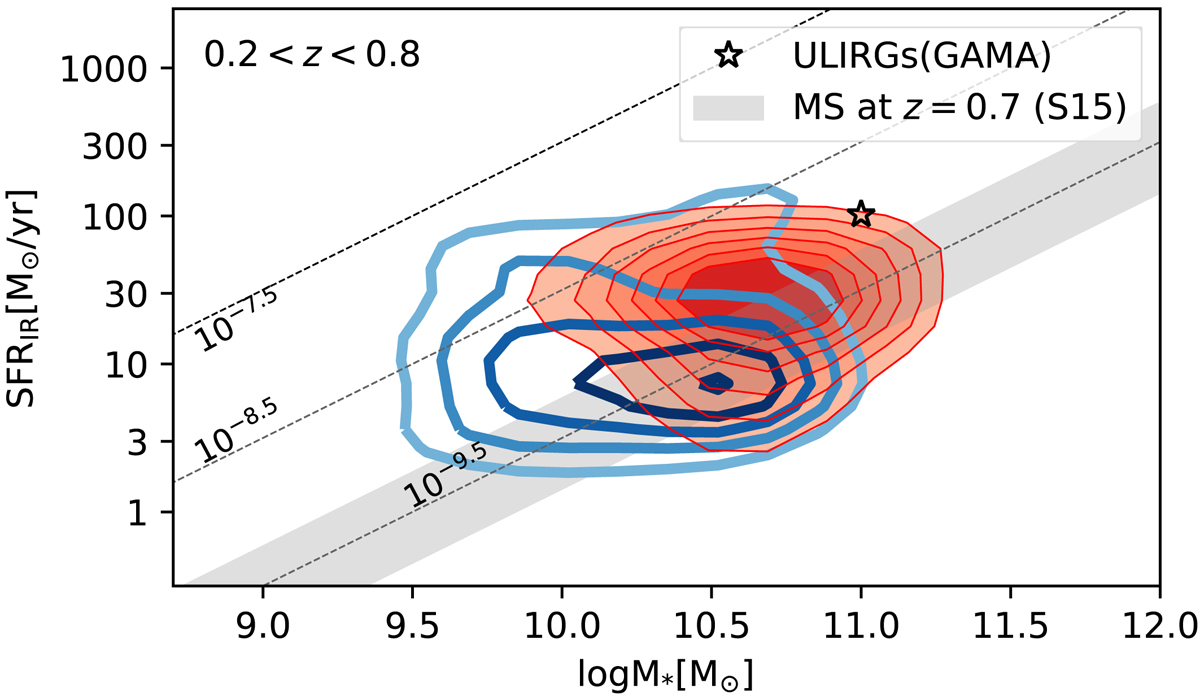
Composite two-dimensional posterior distributions of star-formation rates versus stellar mass for red QSOs (red shaded contour areas) and control QSOs (blue contour lines) for the low-z sources. These are constructed by sampling 100 realization from the posterior of each source to properly account for uncertainties. Stellar masses and star-formation rates are estimated based on SED modelling. The distributions are consistent with the main sequence (grey shaded region), although as well with ULIRGS (GAMA survey; Driver et al. 2018) within the uncertainties.
Current usage metrics show cumulative count of Article Views (full-text article views including HTML views, PDF and ePub downloads, according to the available data) and Abstracts Views on Vision4Press platform.
Data correspond to usage on the plateform after 2015. The current usage metrics is available 48-96 hours after online publication and is updated daily on week days.
Initial download of the metrics may take a while.