Fig. 10.
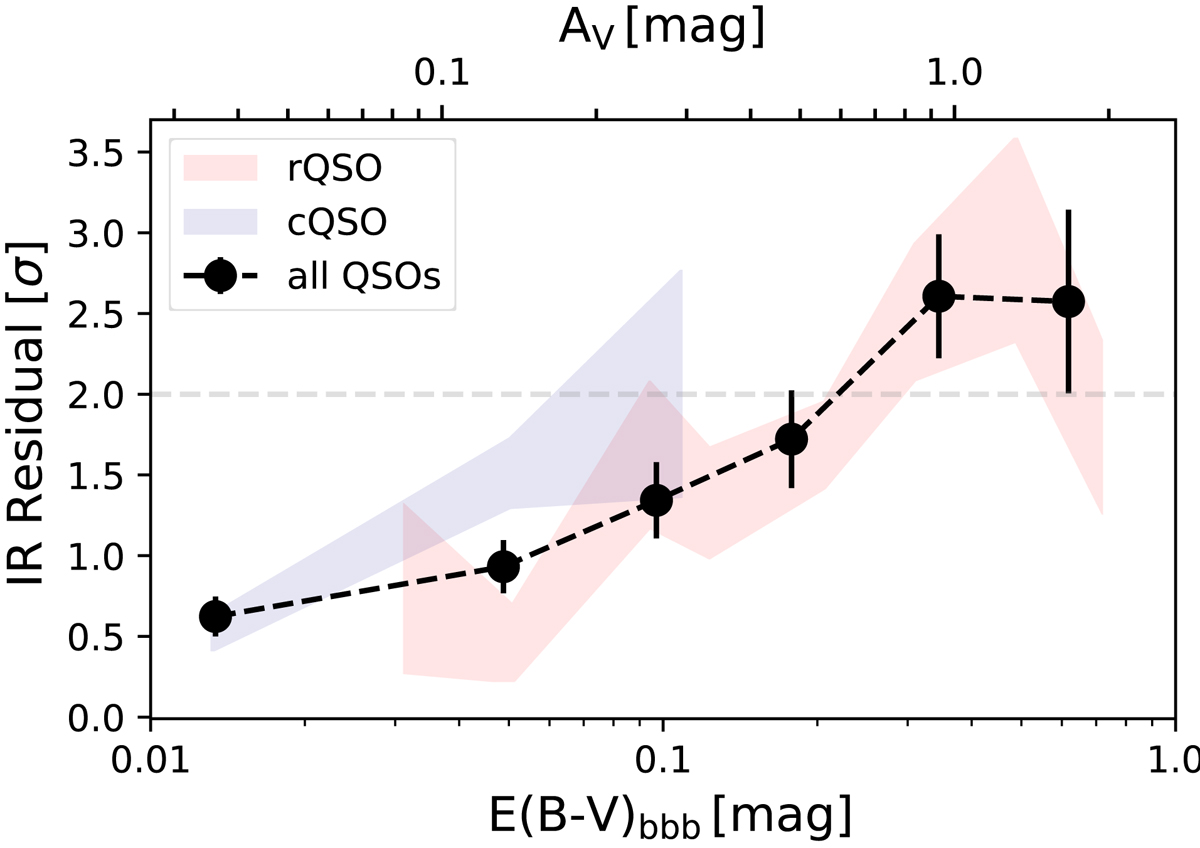
Median infrared residuals are shown as a function of the QSO reddening parameter, E(B − V)BBB. Black circles represent the median residual values for each E(B − V)BBB bin for all QSOs irrespective of colour classification. The error bars represent bootstrap 1-σ errors. The same relation is shown for the red and control QSOs as red and blue shaded areas, respectively. A clear trend can be observed, where the infrared residuals increase with larger reddening values for all samples.
Current usage metrics show cumulative count of Article Views (full-text article views including HTML views, PDF and ePub downloads, according to the available data) and Abstracts Views on Vision4Press platform.
Data correspond to usage on the plateform after 2015. The current usage metrics is available 48-96 hours after online publication and is updated daily on week days.
Initial download of the metrics may take a while.