Fig. 4.
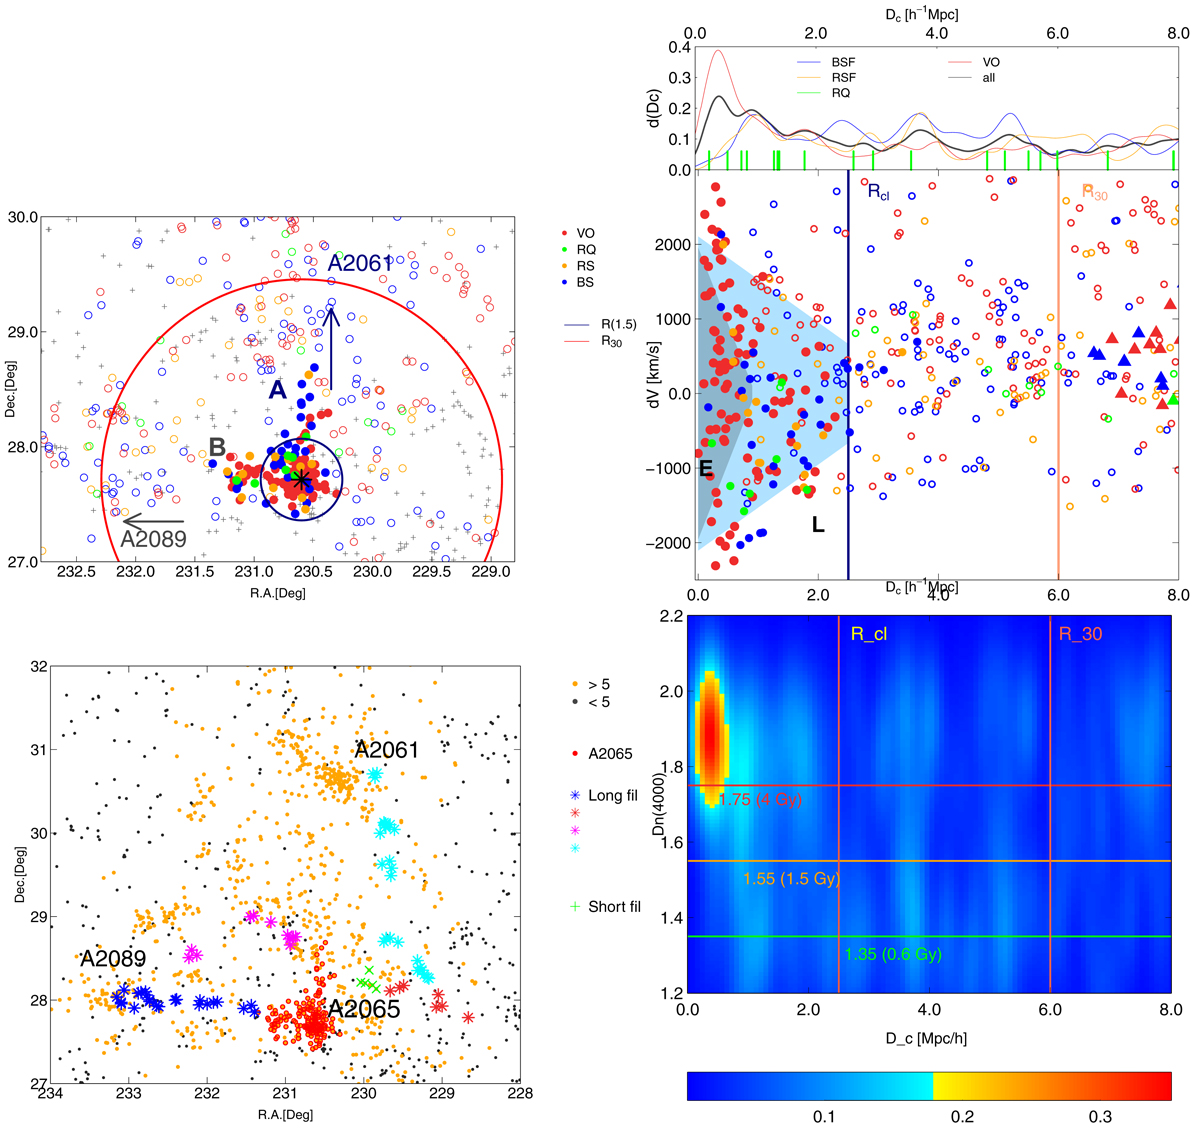
Left panels: distribution of galaxies in A2065 in the plane of the sky. The colours in the upper panel correspond to galaxies from different populations (BSF – blue, RSF – orange, RQ – green, and VO – dark red). Filled symbols denote galaxies in different components of the cluster. Empty circles show galaxies that are not cluster members. Grey crosses denote galaxies in the low-density region with D8 < 5. The inner black circle indicates the scale with a radius 1.5 h−1 Mpc. The outer red circle corresponds to the radius R30 (= 6 h−1 Mpc for A2065). A and B denote substructures that extend from the cluster (see text). The colour in the lower panel shows galaxies in long filaments with a length larger than 5 h−1 Mpc, and in green we plot galaxies in a short filament with a length of 3 h−1 Mpc, which connects the long filament with the cluster. The upper right panel shows the PPS diagram and the distribution of the clustercentric distances Dc for galaxies from different populations in A2065 and in its environment towards A2089. Filled circles represent A2065 members, and filled triangles (at clustercentric distances Dc > 6 h−1 Mpc) show A2089 members. Empty symbols mark galaxies that are not members of these two clusters. The blue region shows the early infall (E) region, and light blue shows late infall (L) region. The lower right panel presents the Dn(4000) index versus clustercentric distance Dc for galaxies from A2065 to A2089. Colours show the density of points at a given location in the plot. Vertical lines correspond to the infall zone of the cluster, Rcl, and to the radius R30. Horizontal lines show Dn(4000) index values Dn(4000) = 1.75, Dn(4000) = 1.55, and Dn(4000) = 1.35 (see Sect. 2.2).
Current usage metrics show cumulative count of Article Views (full-text article views including HTML views, PDF and ePub downloads, according to the available data) and Abstracts Views on Vision4Press platform.
Data correspond to usage on the plateform after 2015. The current usage metrics is available 48-96 hours after online publication and is updated daily on week days.
Initial download of the metrics may take a while.