Fig. 2.
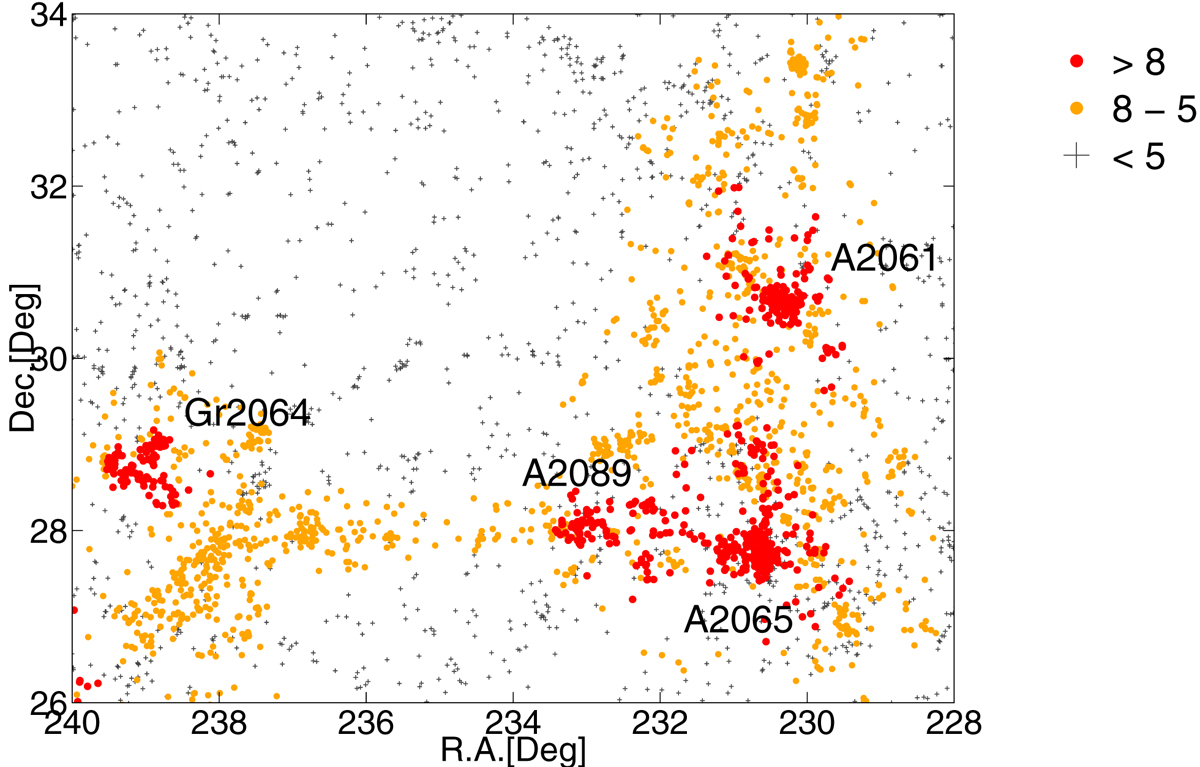
Distribution of galaxies in the CB supercluster region in the plane of the sky. The colour marks the global luminosity density D8. Red circles correspond to the galaxies in high-density cores with D8 ≥ 8, orange circles show galaxies in the outskirts of the supercluster with 5 ≤ D8 < 8, and grey symbols show galaxies in the low-density region around the supercluster with D8 < 5. The ID numbers of the richest clusters in the high-density cores of the supercluster are shown (Abell clusters A2065, A2061, and A2089, and cluster Gr2064 that does not belong to Abell).
Current usage metrics show cumulative count of Article Views (full-text article views including HTML views, PDF and ePub downloads, according to the available data) and Abstracts Views on Vision4Press platform.
Data correspond to usage on the plateform after 2015. The current usage metrics is available 48-96 hours after online publication and is updated daily on week days.
Initial download of the metrics may take a while.