Fig. 16.
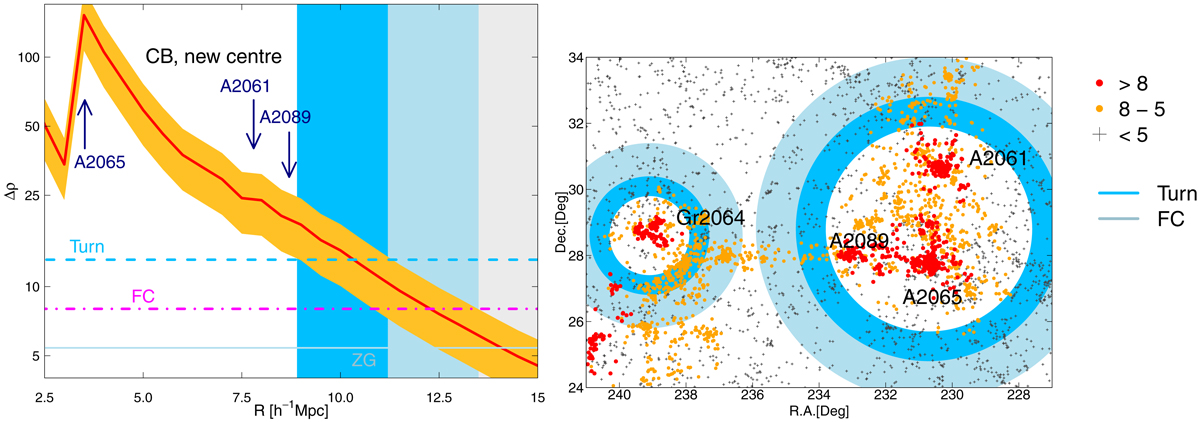
Left panel: density contrast Δρ = ρ/ρm vs. clustercentric distance Dc for the possible new centre of the main part of the CB. Notations are as in Fig. 13. Arrows mark the distances of clusters A2065, A2061, and A2089 at which they join the possible new collapsing system. Right panel: sky distribution of galaxies in the CB. Filled circles mark turnaround (blue) and future collapse (light blue) zones in the supercluster, as shown in the left panel. Colours are as in Fig. 2.
Current usage metrics show cumulative count of Article Views (full-text article views including HTML views, PDF and ePub downloads, according to the available data) and Abstracts Views on Vision4Press platform.
Data correspond to usage on the plateform after 2015. The current usage metrics is available 48-96 hours after online publication and is updated daily on week days.
Initial download of the metrics may take a while.