Fig. 13.
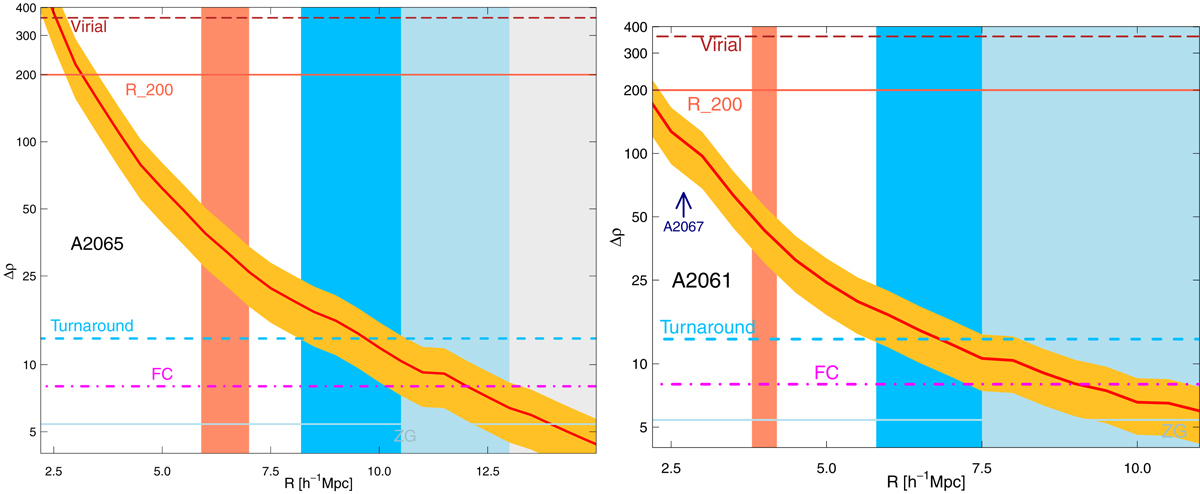
Density contrast Δρ = ρ/ρm vs. clustercentric distance for A2065 (left panel) and for A2061 (rich panel). The density contrast for the centre cluster is plotted with the red line. The golden area shows the error corridor from the mass errors. Characteristic density contrasts are denoted as follows: Δρ = 360 (virial), Δρ = 200 (r200), Δρ = 13.1 (turnaround, dashed blue line), Δρ = 8.73 (FC, dash-dotted violet line), and Δρ = 5.41 (ZG, solid light blue line). Blue, light blue, and grey areas mark the borders of the turnaround, FC, and ZG regions. The red area marks R30. The arrow in the right panel marks the average distance of cluster A2067 from the centre of A2061.
Current usage metrics show cumulative count of Article Views (full-text article views including HTML views, PDF and ePub downloads, according to the available data) and Abstracts Views on Vision4Press platform.
Data correspond to usage on the plateform after 2015. The current usage metrics is available 48-96 hours after online publication and is updated daily on week days.
Initial download of the metrics may take a while.