Fig. 1.
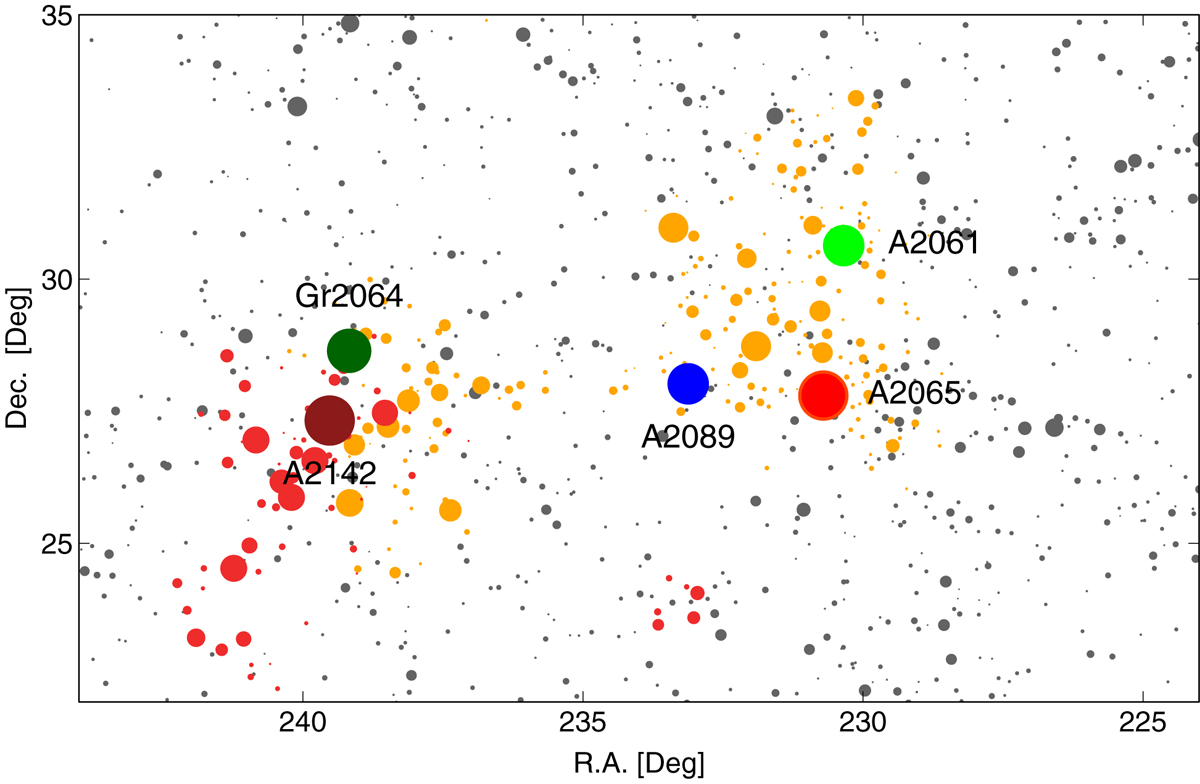
Distribution of galaxy groups in a large region around the CB in the plane of the sky. The size of the circles is proportional to group size in the sky. Grey circles show the positions of groups in a low global density environment, D8 < 5. Orange circles correspond to groups in the CB supercluster, and red circles show groups in a high global density environment with D8 ≥ 8 that do not belong to the CB. These groups mostly lie in supercluster SCl A2142. In the sky projection, part of the CB supercluster is projected on SCl A2142, and some groups from these superclusters overlap in the figure. Large coloured circles indicate the location of the richest clusters with corresponding ID numbers.
Current usage metrics show cumulative count of Article Views (full-text article views including HTML views, PDF and ePub downloads, according to the available data) and Abstracts Views on Vision4Press platform.
Data correspond to usage on the plateform after 2015. The current usage metrics is available 48-96 hours after online publication and is updated daily on week days.
Initial download of the metrics may take a while.