Fig. 6.
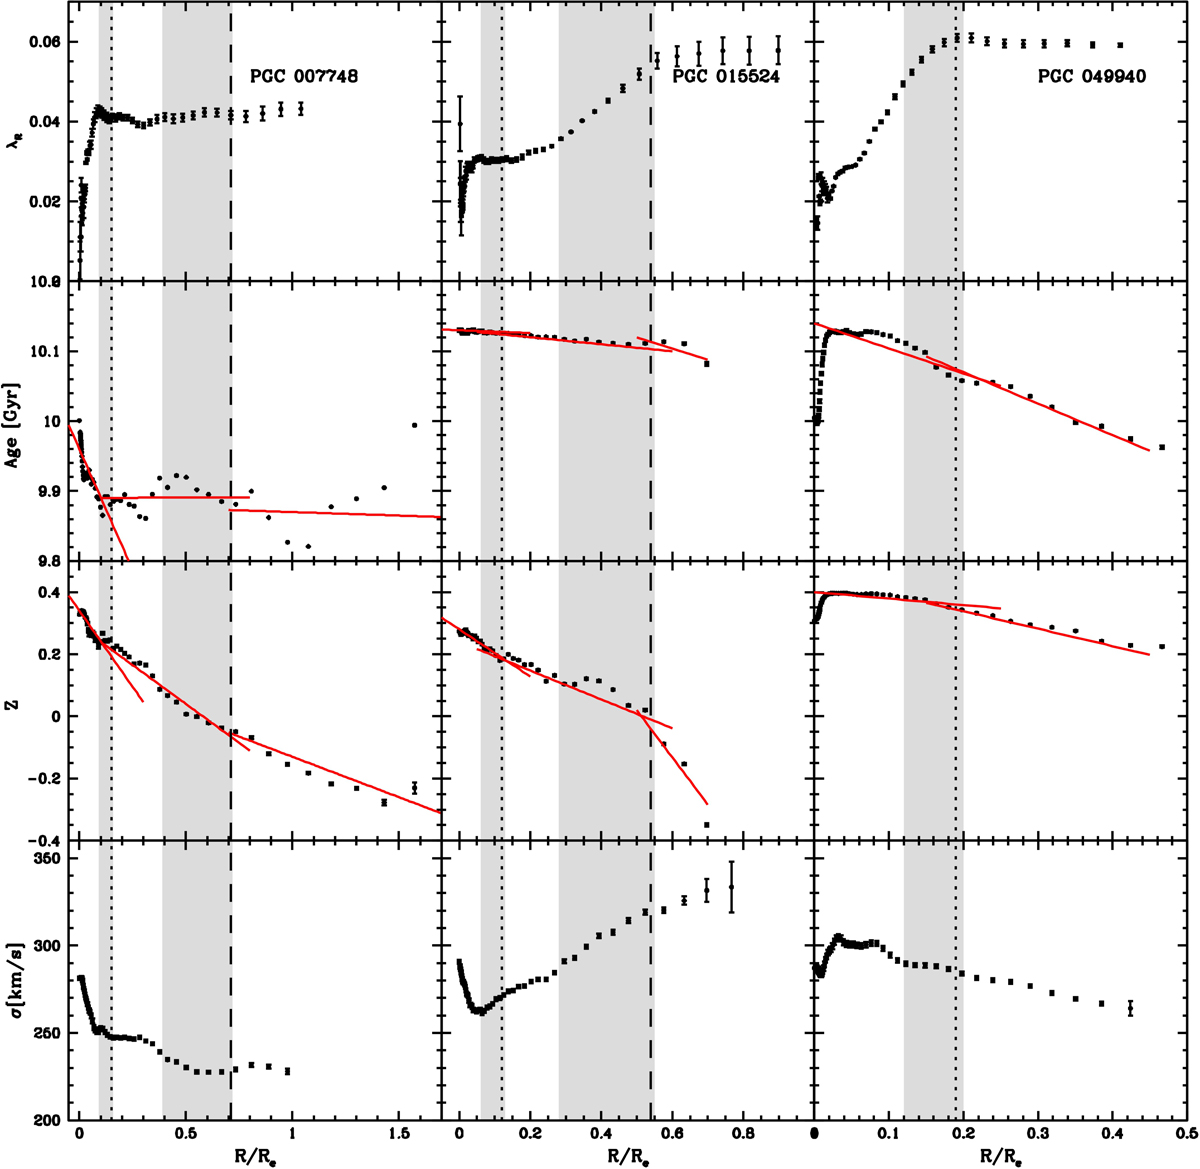
Velocity dispersion, metallicity, age, and λR profiles for PGC007748 (left), PGC015524 (middle), and PGC049940 (right). The vertical dotted and dashed lines mark the position of the first and second transition radii, respectively. The gray shaded areas mark the transition regions between different components of the fit (see Sect. 5), and the red lines show the fit performed to estimate the slopes reported in Table 3.
Current usage metrics show cumulative count of Article Views (full-text article views including HTML views, PDF and ePub downloads, according to the available data) and Abstracts Views on Vision4Press platform.
Data correspond to usage on the plateform after 2015. The current usage metrics is available 48-96 hours after online publication and is updated daily on week days.
Initial download of the metrics may take a while.