Fig. 5.
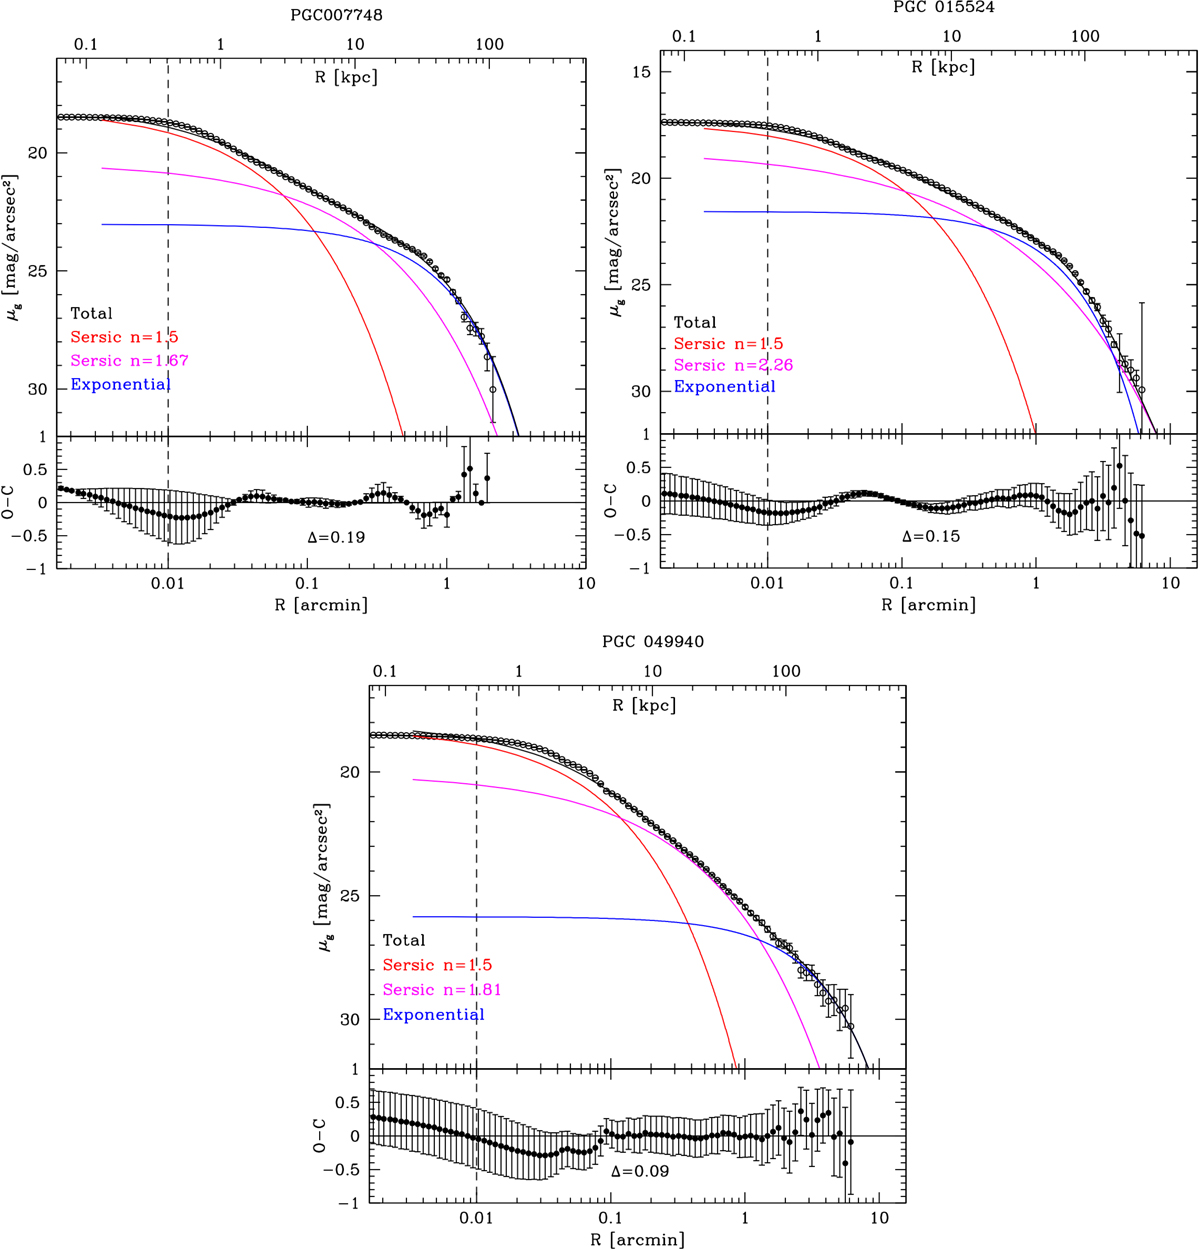
VST g-band profile of PGC007748 (top left), PGC015524 (top right), and PGC049940 (bottom) in linear scale, fit with a three-component model motivated by the predictions of theoretical simulations (see Spavone et al. (2017)). The bottom panels in each plot show the Δ rms scatter, obtained from the difference between the observed profiles (O) and the sum of the components from each fit (C). The dashed lines in all the panels indicate the galaxy cores.
Current usage metrics show cumulative count of Article Views (full-text article views including HTML views, PDF and ePub downloads, according to the available data) and Abstracts Views on Vision4Press platform.
Data correspond to usage on the plateform after 2015. The current usage metrics is available 48-96 hours after online publication and is updated daily on week days.
Initial download of the metrics may take a while.