Fig. 1.
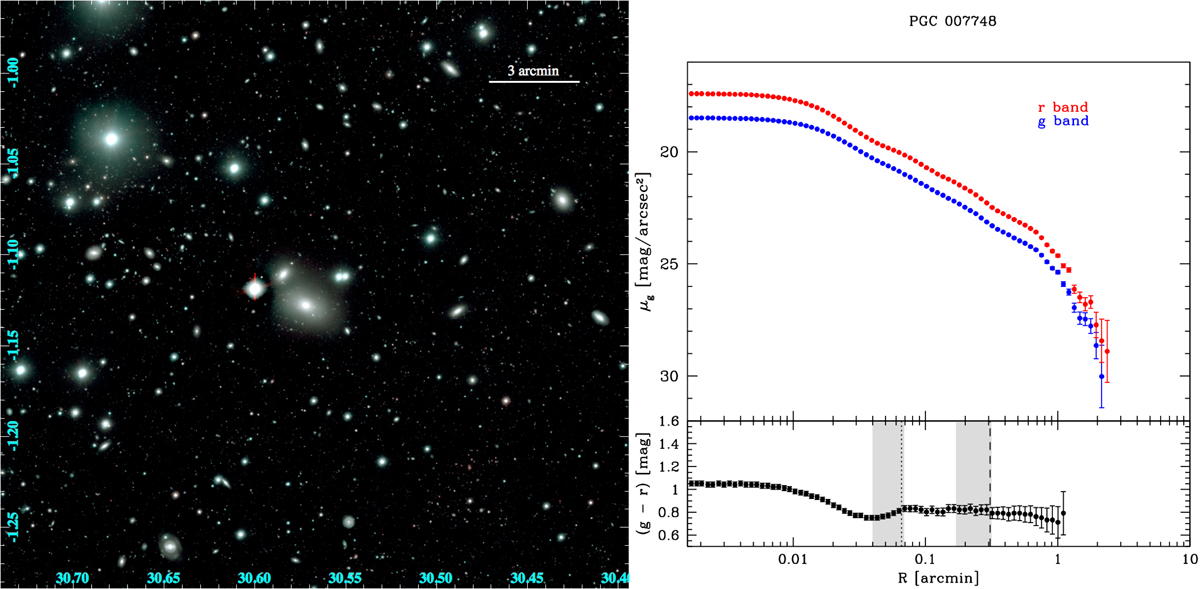
Left panel: VST color-composite gr image of the 20.7 arcmin × 19.4 arcmin field around PGC 7748. Top right panel: azimuthally averaged surface brightness profiles in the g (blue) and r (red) bands. Bottom right panel: azimuthally averaged (g − r) color profile. The vertical dotted and dashed lines mark the position of the first and second transition radii, respectively, and the gray shaded areas are the transition regions (see Sect. 5).
Current usage metrics show cumulative count of Article Views (full-text article views including HTML views, PDF and ePub downloads, according to the available data) and Abstracts Views on Vision4Press platform.
Data correspond to usage on the plateform after 2015. The current usage metrics is available 48-96 hours after online publication and is updated daily on week days.
Initial download of the metrics may take a while.