Fig. 1
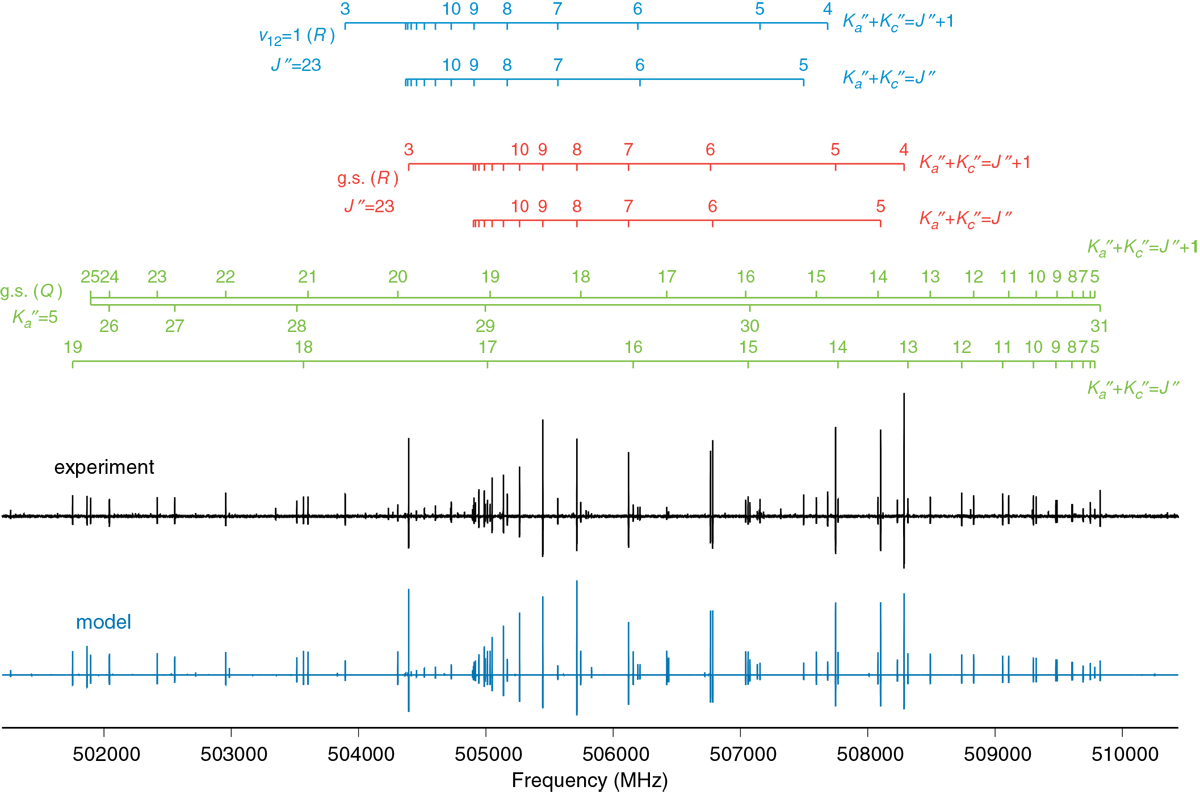
Sample spectrum of CH2NOH at 500 GHz. The experimental spectrum is plotted in black, and the model (with both the ground state and the v12 = 1 state) is plotted in blue sticks. Above the spectrum, the frequencies of three different branches are illustrated separately. Quantum numbers of the upper state are labeled for each branch where space is permitted.
Current usage metrics show cumulative count of Article Views (full-text article views including HTML views, PDF and ePub downloads, according to the available data) and Abstracts Views on Vision4Press platform.
Data correspond to usage on the plateform after 2015. The current usage metrics is available 48-96 hours after online publication and is updated daily on week days.
Initial download of the metrics may take a while.