Fig. 9.
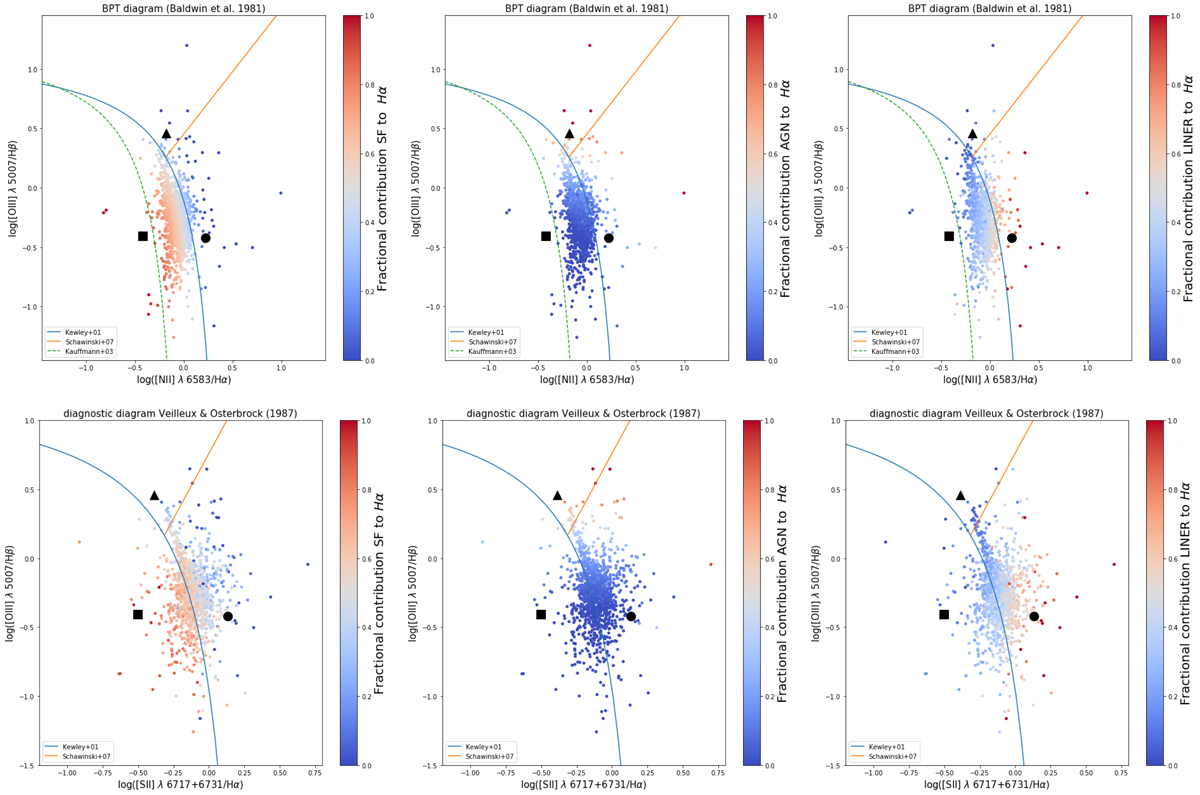
Upper three panels and lower three panels: BPT diagram and the diagnostic diagram of Veilleux & Osterbrock (1987), respectively, with the line ratios extracted from the total emission line fluxes of the individual spaxels. The SF, AGN, and LINER base spectra are depicted as the black square, triangle and circle, respectively. The data points are colour coded according to the fraction of Hα emission attributable to SF (left-hand panels), AGN (middle panels), and ‘LINER’ (right-hand panels), as computed from the spectral decomposition method described in Davies et al. (2017).
Current usage metrics show cumulative count of Article Views (full-text article views including HTML views, PDF and ePub downloads, according to the available data) and Abstracts Views on Vision4Press platform.
Data correspond to usage on the plateform after 2015. The current usage metrics is available 48-96 hours after online publication and is updated daily on week days.
Initial download of the metrics may take a while.