Free Access
Fig. 4.
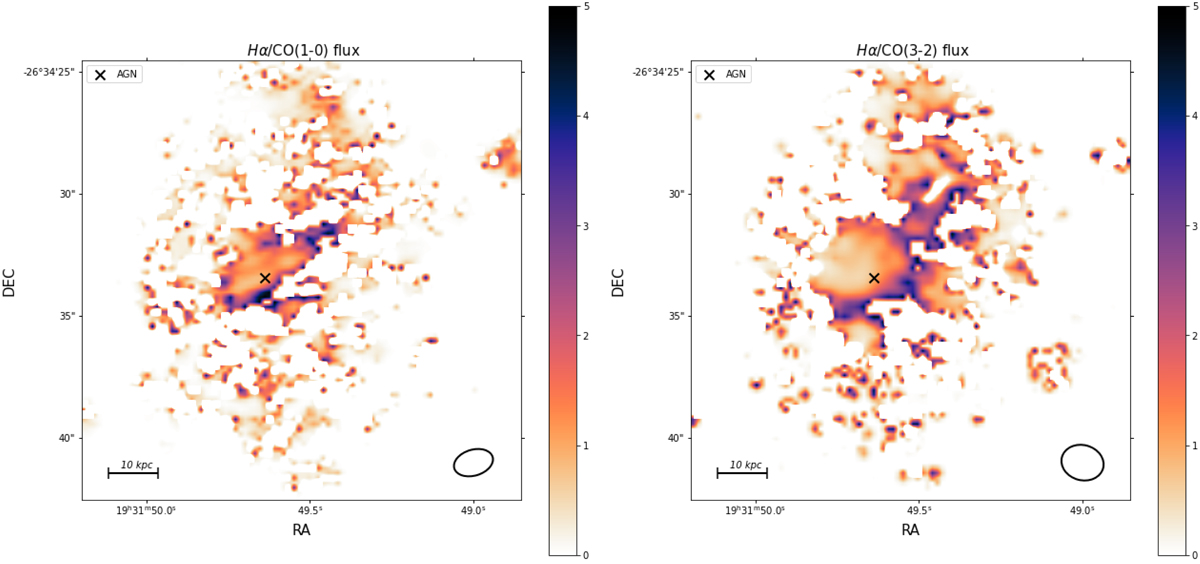
Comparison between Hα and CO linear normalised flux. Left panel: ratio between Hα and CO(1-0) fluxes. Right panel: ratio between the fluxes of Hα and CO(3-2). The cross shows the location of the AGN. The ellipses in the lower right of both panels depict the beam sizes of the ALMA observations.
Current usage metrics show cumulative count of Article Views (full-text article views including HTML views, PDF and ePub downloads, according to the available data) and Abstracts Views on Vision4Press platform.
Data correspond to usage on the plateform after 2015. The current usage metrics is available 48-96 hours after online publication and is updated daily on week days.
Initial download of the metrics may take a while.