Fig. 3.
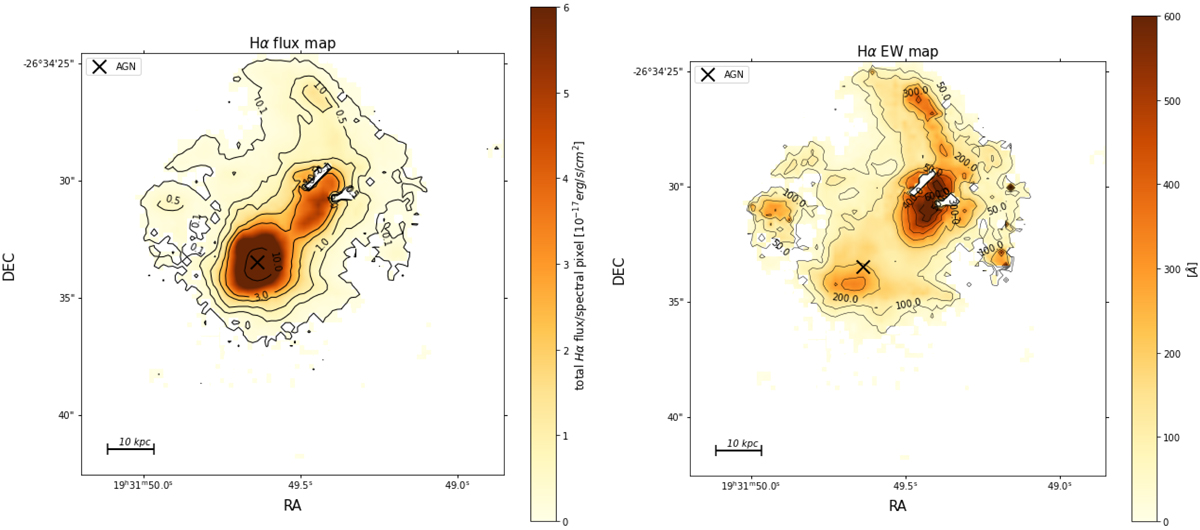
Left: spatially resolved Hα emission line map for the BCG of the M1931 galaxy cluster. The colour-bar shows the flux of the Hα line in units of 10−17 ergs s−1 cm−2. Right: Hα equivalent width map measured in Å. The contours correspond to different levels of flux and EW. The white background in both plots corresponds to spaxels with S/NHα < 10. The cross shows the location of the AGN.
Current usage metrics show cumulative count of Article Views (full-text article views including HTML views, PDF and ePub downloads, according to the available data) and Abstracts Views on Vision4Press platform.
Data correspond to usage on the plateform after 2015. The current usage metrics is available 48-96 hours after online publication and is updated daily on week days.
Initial download of the metrics may take a while.