Fig. B.1.
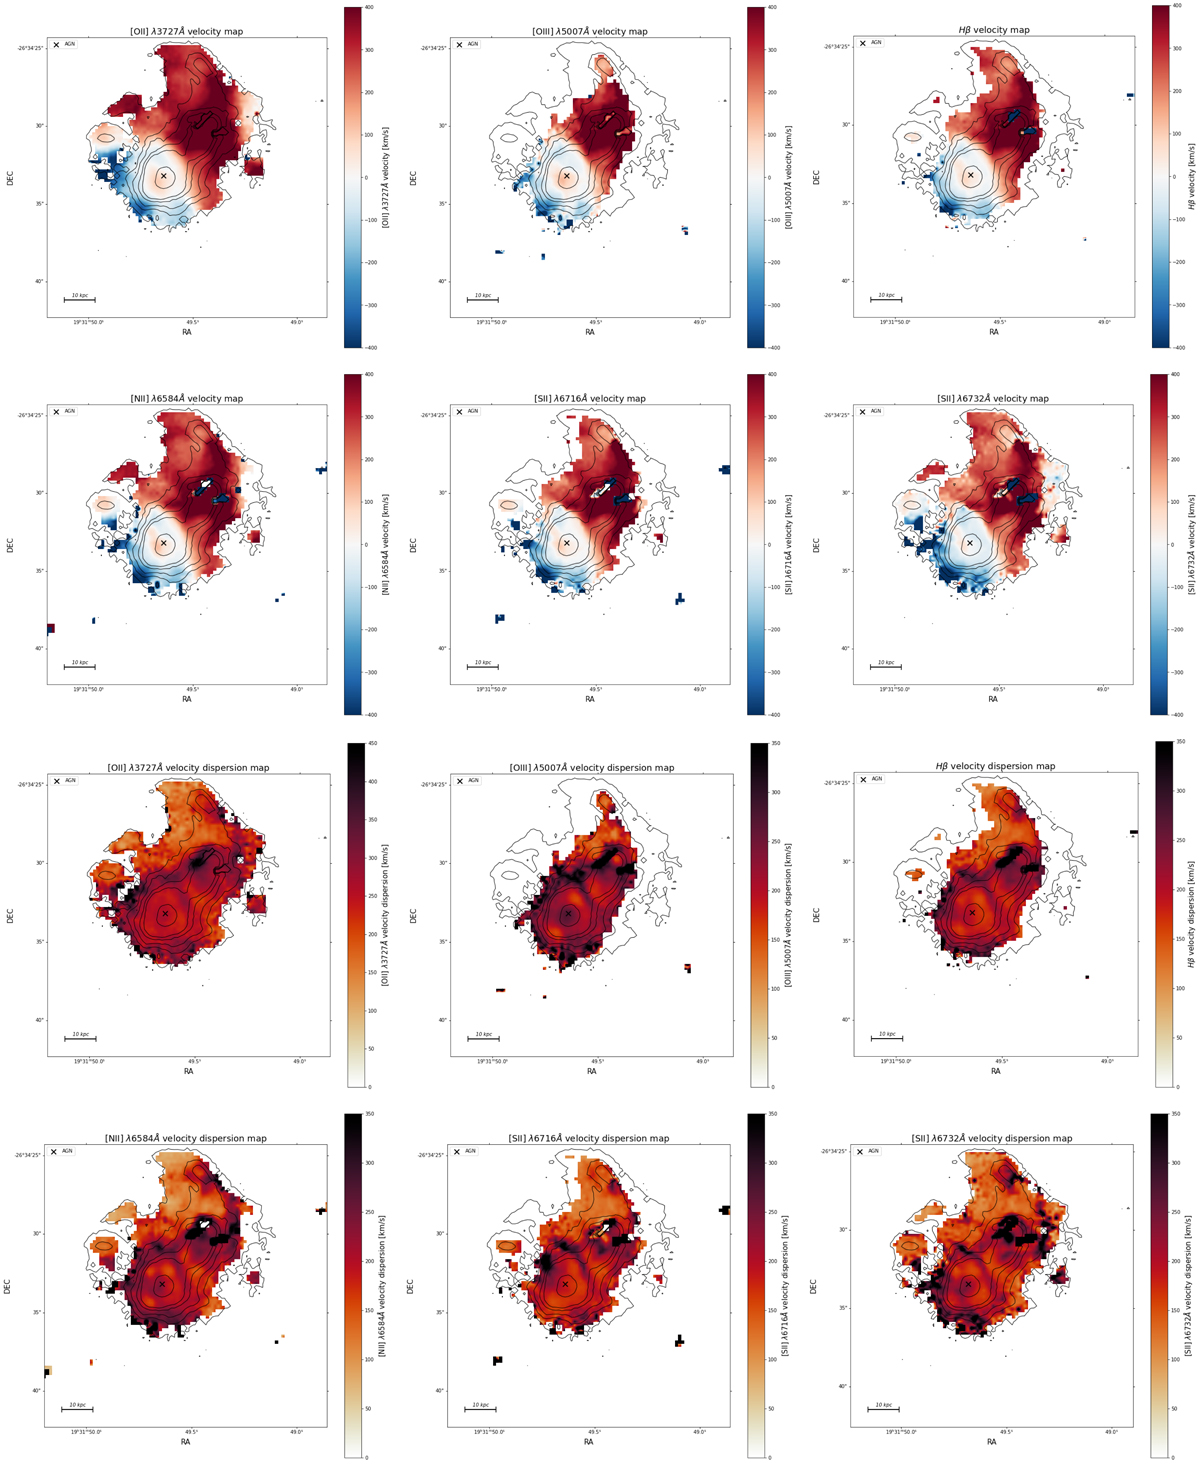
Kinematics of the warm ionised gas. The panels from the upper two rows display the spatially resolved radial velocity maps for the [O II] λ3727, [O III] λ5007, Hβ, [N II] λ6584, [S II] λ6718, 6732 gas in the BCG of the M1931 galaxy cluster. The colour-bar displays the radial velocity of the gas with respect to the BCG rest frame, measured in [km/s]. The panels from the lower two rows show the spatially resolved velocity dispersion maps for the same emission lines, measured in [km/s]. The white background in all plots correspond to the spaxels with an S/N < 10. The cross shows the location of the AGN. The contours show the Hα flux intensity.
Current usage metrics show cumulative count of Article Views (full-text article views including HTML views, PDF and ePub downloads, according to the available data) and Abstracts Views on Vision4Press platform.
Data correspond to usage on the plateform after 2015. The current usage metrics is available 48-96 hours after online publication and is updated daily on week days.
Initial download of the metrics may take a while.