Fig. 16.
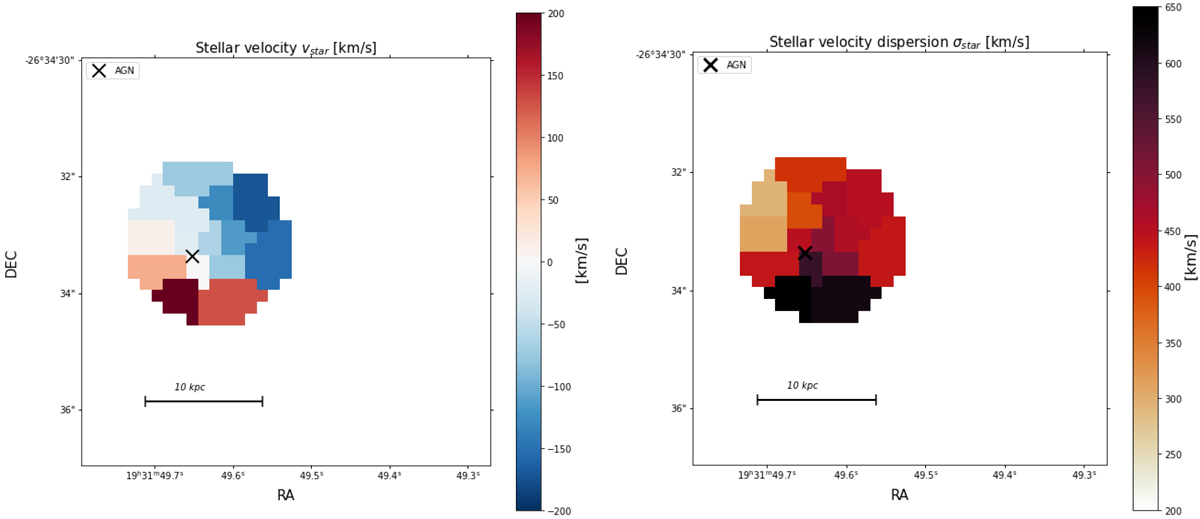
Left: radial velocity of the stars with respect to the systemic velocity of the most central region of the system. Right: velocity dispersion of the stars in the BCG. The colour-bar in both plots depicts the radial velocity and velocity dispersion in units of [km/s]. Due to the low S/N in the stellar continuum, the data needs binning, and we can, therefore, measure the stellar kinematics only in the core of the system. To better visualise the results, we present maps showing just the most central regions of the BCG, corresponding to a spatial scale of 45 × 45 kpc. The white background corresponds to the spaxels, where the S/Nstellar continuum < 10. The cross shows the location of the AGN.
Current usage metrics show cumulative count of Article Views (full-text article views including HTML views, PDF and ePub downloads, according to the available data) and Abstracts Views on Vision4Press platform.
Data correspond to usage on the plateform after 2015. The current usage metrics is available 48-96 hours after online publication and is updated daily on week days.
Initial download of the metrics may take a while.