Fig. 12.
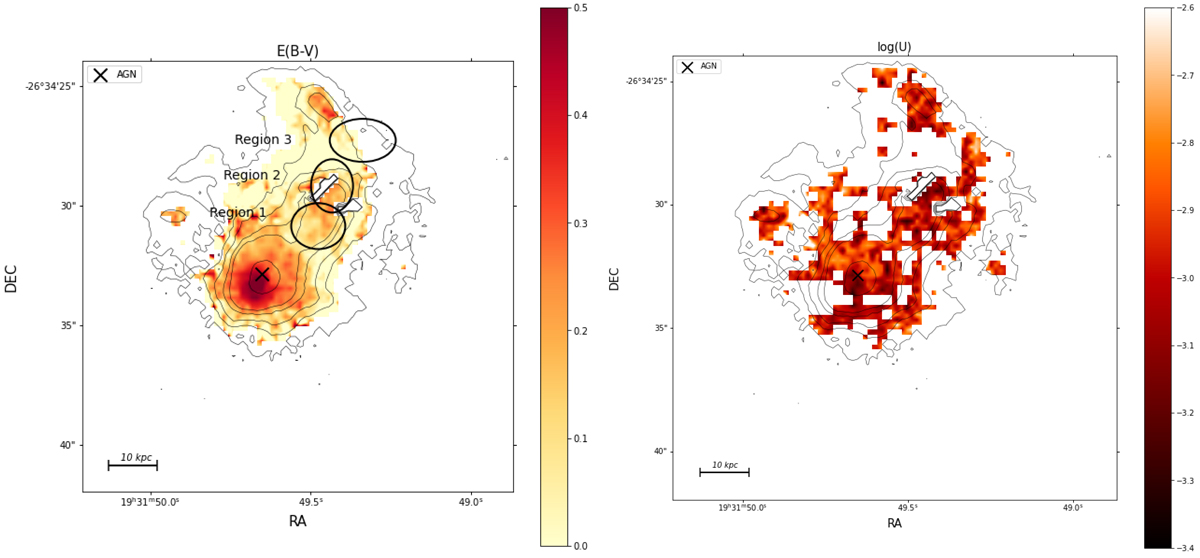
Left: colour excess map for the M1931 BCG as computed from the Balmer decrement. Right: ionisation parameter map, as computed from the HII-CH-mistry tool (Pérez-Montero et al. 2014). The cross in all diagrams shows the location of the AGN. The contours show the Hα flux intensity. The white background corresponds to the spaxels with an S/N < 10 in the emission lines of interest.
Current usage metrics show cumulative count of Article Views (full-text article views including HTML views, PDF and ePub downloads, according to the available data) and Abstracts Views on Vision4Press platform.
Data correspond to usage on the plateform after 2015. The current usage metrics is available 48-96 hours after online publication and is updated daily on week days.
Initial download of the metrics may take a while.