Free Access
Fig. 1.
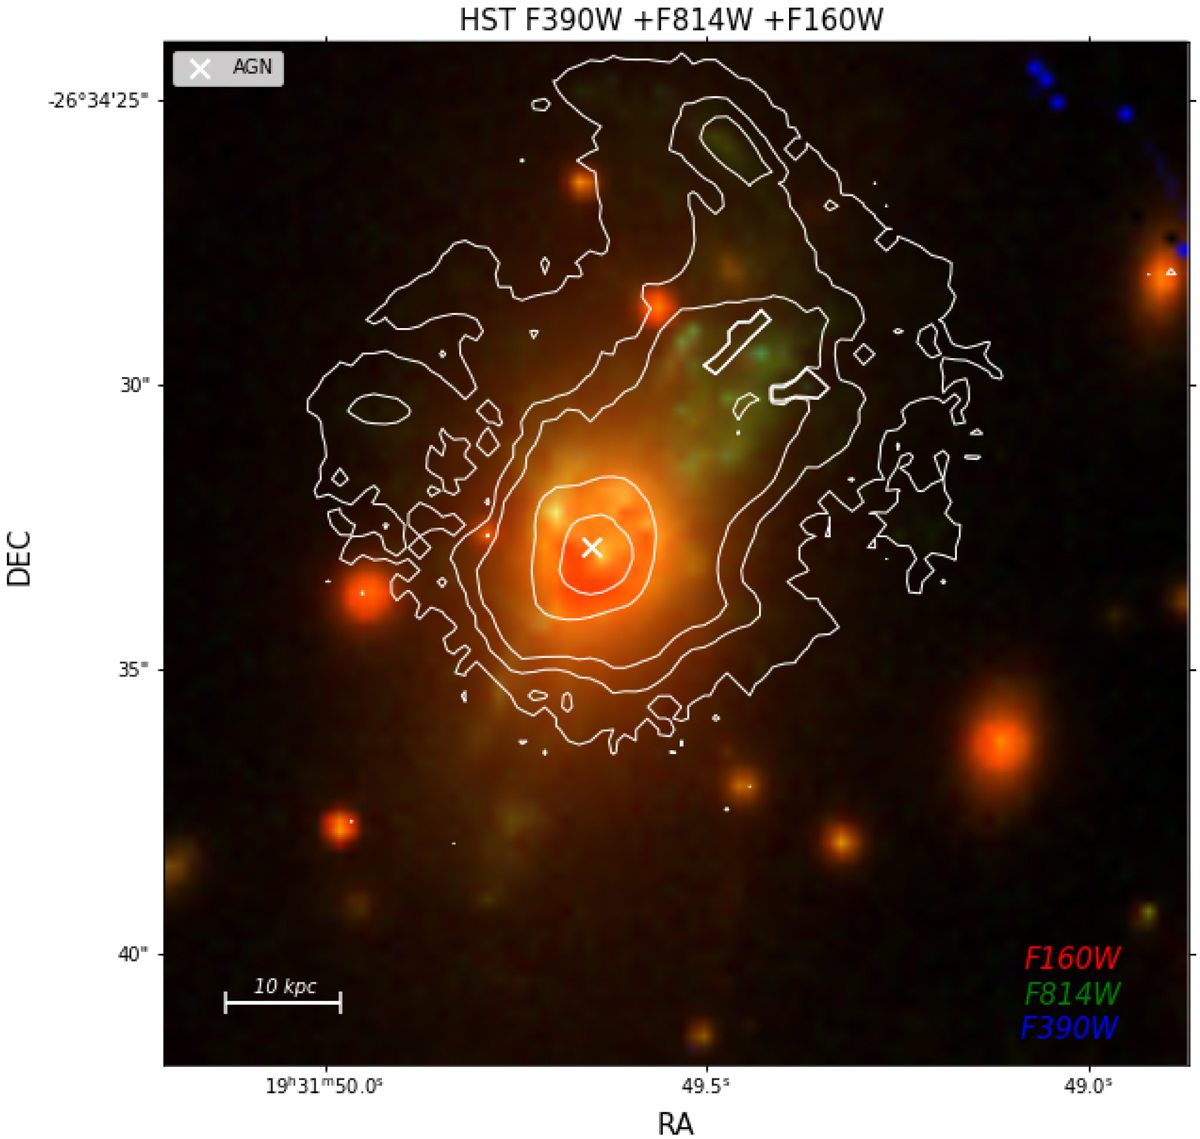
HST composite RGB image of the M1931 BCG: the F160W image is shown in red, the F814W in green, and the F390W in blue. The white contours show to the Hα flux intensity, as measured from MUSE. The cross shows the location of the AGN, as identified according to different diagnostic diagrams; see Sect. 5.5.
Current usage metrics show cumulative count of Article Views (full-text article views including HTML views, PDF and ePub downloads, according to the available data) and Abstracts Views on Vision4Press platform.
Data correspond to usage on the plateform after 2015. The current usage metrics is available 48-96 hours after online publication and is updated daily on week days.
Initial download of the metrics may take a while.