| Issue |
A&A
Volume 649, May 2021
|
|
|---|---|---|
| Article Number | A155 | |
| Number of page(s) | 16 | |
| Section | Stellar structure and evolution | |
| DOI | https://doi.org/10.1051/0004-6361/202039954 | |
| Published online | 02 June 2021 | |
Double detonations of sub-MCh CO white dwarfs: variations in Type Ia supernovae due to different core and He shell masses⋆
1
Zentrum für Astronomie der Universität Heidelberg, Astronomisches Rechen-Institut, Mönchhofstr. 12-14, 69120 Heidelberg, Germany
e-mail: This email address is being protected from spambots. You need JavaScript enabled to view it.
2
Heidelberger Institut für Theoretische Studien, Schloss-Wolfsbrunnenweg 35, 69118 Heidelberg, Germany
3
Astrophysics Research Center, School of Mathematics and Physics, Queen’s University Belfast, Belfast, BT7 1NN Northern Ireland, UK
4
GSI Helmholtzzentrum für Schwerionenforschung, Planckstraße 1, 64291 Darmstadt, Germany
5
Zentrum für Astronomie der Universität Heidelberg, Institut für theoretische Astrophysik, Philosophenweg 12, 69120 Heidelberg, Germany
Received:
20
November
2020
Accepted:
6
March
2021
Abstract
Sub-Chandrasekhar mass carbon-oxygen white dwarfs with a surface helium shell have been proposed as progenitors of Type Ia supernovae (SNe Ia). If true, the resulting thermonuclear explosions should be able to account for at least some of the range of SNe Ia observables. To study this, we conducted a parameter study based on three-dimensional simulations of double detonations in carbon-oxygen white dwarfs with a helium shell, assuming different core and shell masses. An admixture of carbon to the shell and solar metallicity are included in the models. The hydrodynamic simulations were carried out using the AREPO code. This allowed us to follow the helium shell detonation with high numerical resolution, and this improves the reliability of predicted nucleosynthetic shell detonation yields. The addition of carbon to the shell leads to a lower production of 56Ni, while including solar metallicity increases the production of intermediate mass elements. The production of higher mass elements is further shifted to stable isotopes at solar metallicity. Moreover, we find different core detonation ignition mechanisms depending on the core and shell mass configuration. This has an influence on the ejecta structure. We present the bolometric light curves predicted from our explosion simulations using the Monte Carlo radiative transfer code ARTIS and make comparisons with bolometric SNe Ia data. The bolometric light curves of our models show a range of brightnesses, which is able to account for subluminous to normal brightness SNe Ia. We show the model bolometric width-luminosity relation compared to data for a range of model viewing angles. We find that, on average, our brighter models lie within the observed data. The ejecta asymmetries produce a wide distribution of observables, which might account for outliers in the data. However, the models overestimate the extent of this compared to data. We also find that the bolometric decline rate over 40 days, Δm40(bol), appears systematically faster than data.
Key words: supernovae: general / white dwarfs / radiative transfer / nuclear reactions / nucleosynthesis / abundances / methods: numerical / hydrodynamics
Full Tables A.1–A.4 are only available at the CDS via anonymous ftp to cdsarc.u-strasbg.fr (130.79.128.5) or via http://cdsarc.u-strasbg.fr/viz-bin/cat/J/A+A/649/A155
Fellow of the International Max Planck Research School for Astronomy and Cosmic Physics at Heidelberg University (IMPRS-HD).
© ESO 2021
1. Introduction
A widely discussed progenitor of a Type Ia supernova (SN Ia) is a sub-Chandrasekhar mass (sub-MCh) white dwarf (WD) (e.g., Shigeyama et al. 1992; Nugent et al. 1997; Hoeflich et al. 1998; García-Senz et al. 1999; Fink et al. 2007, 2010; Sim et al. 2010, 2013a; Blondin et al. 2017a; Shen et al. 2018a; Liu et al. 2018; Polin et al. 2019; Leung & Nomoto 2020) in a binary system. Its detonation can reproduce several observed features of a SN Ia (Sim et al. 2010). Compared to the alternative model of a WD exploding when it approaches the Chandrasekhar mass, a strength of this scenario is that it directly relates the amount of produced 56Ni and thus the brightness of the event to a fundamental parameter of the progenitor – its mass. Such explosions roughly follow the trend of the observed “width-luminosity” relation between the peak brightness and decay after maximum light in the B-band (Phillips 1993; Phillips et al. 1999), again with the progenitor’s mass being the ordering parameter (Sim et al. 2010, predicted by Pinto & Eastman 2000). In contrast, models fixing the progenitor mass to the Chandrasekhar limit struggle with reproducing this important relation (Sim et al. 2013b, but see Kasen et al. 2009, and Blondin et al. 2017b; Shen et al. 2018b for sub-MCh models). Kushnir et al. (2020) and Sharon & Kushnir (2020), however, argue that the t0 − M56Ni relation cannot be reproduced with sub-MCh WD models to date, with t0 being the γ-ray escape time from the ejecta which can be determined from bolometric light curves (Wygoda et al. 2019). Therefore, it is of interest to investigate the progenitor models for normal SNe Ia. We do this here as validation of the double detonation scenario.
The drawback of the sub-MCh scenario is that the initiation of the thermonuclear explosion is not as straightforward as in the Chandrasekhar-mass model (see Hillebrandt et al. 2013; Maoz et al. 2014; Livio & Mazzali 2018; Röpke & Sim 2018; Soker 2019, for reviews on different progenitor systems and explosion scenarios). Several mechanisms have been proposed for initiating the detonation of a sub-MCh WD. WDs can interact with another WD (double degenerate scenario) (e.g., Whelan & Iben 1973; Webbink 1984; Kashyap et al. 2015; Tanikawa et al. 2018; Rebassa-Mansergas et al. 2019) or with another star, such as a He star, (single degenerate scenario) in a binary system (e.g., Whelan & Iben 1973; Dave et al. 2017). A violent merger of two WDs (Guillochon et al. 2010; Pakmor et al. 2010, 2011, 2013) could ignite an explosion as well. The most violent mechanism is presented in a collision model (e.g., Piro et al. 2014; Wygoda et al. 2019).
Population synthesis calculations by Belczynski et al. (2005) and Ruiter et al. (2009) indicate that the double degenerate scenario occurs often enough to explain a significant part of the SN Ia rate. However, studies by other groups, such as Toonen et al. (2012) and Liu et al. (2018), indicate that the contribution is lower.
A much discussed explosion mechanism is the double detonation scenario (e.g., Woosley & Weaver 1994; Fink et al. 2007, 2010; Moll & Woosley 2013; Shen et al. 2018a; Townsley et al. 2019; Leung & Nomoto 2020; Gronow et al. 2020). In this case, a carbon-oxygen (CO) WD accretes helium (He) from a companion, for example a He star (Iben et al. 1987) or He WD (Tutukov & Yungelson 1996). A He detonation can be ignited through compressional heating of the accreted material. This detonation propagates through the He shell and sends a shock wave into the CO core. A second detonation in the carbon-oxygen material is ignited following its convergence.
We carried out a parameter study to investigate the effects of different core and He shell masses of exploding WDs. Neunteufel et al. (2016) model short period binary systems of a CO WD with a He star. They consider different WD core masses and follow the accretion process. The mass ranges they find for the accreted He shell (see their Fig. 6) are partially covered in our parameter study and depend on the donor mass as well as the orbital period. Similar parameter studies to ours have been carried out by Fink et al. (2007, 2010), Polin et al. (2019) and Leung & Nomoto (2020). Fink et al. (2007) look into the effect of different ignition configurations in the He shell, while Fink et al. (2010) only consider certain core and shell mass combinations. Polin et al. (2019) study a much wider parameter space which partially overlaps with that in our work. They, however, consider zero metallicity of the zero-age main sequence progenitor and follow the evolution with one-dimensional (1D) explosion simulations. The models by Fink et al. (2007, 2010) and Leung & Nomoto (2020) are two-dimensional (2D). Three-dimensional (3D) simulations are carried out by Moll & Woosley (2013), though they only compute one quarter of the WD.
The parameter study presented here is based on full 3D simulations using the moving mesh code AREPO (Springel 2010). This approach allows for a more accurate treatment of the detonation dynamics than the level-set method used by Fink et al. (2010). The mass of the CO WD cores is set to be between 0.8 M⊙ and 1.1 M⊙. Since the He shell masses depend on the accretion rate, our models consider a range of 0.02 M⊙ to 0.1 M⊙. The shell and core mass combinations were chosen to match models in previous work (e.g., Woosley et al. 2011; Polin et al. 2019; Townsley et al. 2019). Of particular interest are models with low-mass He shells (Fink et al. 2010; Townsley et al. 2019) because the imprints of massive He shell detonations are found to be inconsistent with observations of normal SNe Ia (Höflich et al. 1996; Kromer et al. 2010). The admixture of carbon from the WD core into the shell considered in our models further decreases the amount of free α-particles and less heavy elements are produced (see Yoon et al. 2004; Fink et al. 2010; Gronow et al. 2020). All our models are calculated assuming solar metallicity of the zero-age main sequence progenitors.
The AREPO code enables us to increase the resolution in selected regions. Using its adaptive mesh refinement, we reached a higher resolution in the He shell compared to previous work (e.g., Fink et al. 2007; Moll & Woosley 2013). Consequently, the propagation of the He detonation wave and its critical nucleosynthesis yields could be modeled more accurately than in previous studies.
The methods used in this parameter study are described in Sect. 2. In Sect. 3 we present the model setup succeeded by a discussion of the results from the explosion simulations in Sect. 4. A discussion of our models in the context of previous simulations follows in Sect. 5. Synthetic observables are analyzed in Sect. 6. The conclusions are presented in Sect. 7. The 1D structure and nucleosynthesis yields will be made available on the supernova archive HESMA (Kromer et al. 2017).
2. Methods
2.1. Hydrodynamics
We carried out 3D simulations using the AREPO code (Springel 2010). Extensions, such as the Helmholtz equation of state (Timmes & Swesty 2000), were implemented by Pakmor et al. (2012, 2013, 2016). Other extensions allow us to couple the hydrodynamic solver of the moving mesh code to a nuclear network solver (Pakmor et al. 2012). The energy equation and balance equations for nuclear isotopes are extended by a source term to model reactive flows. We used the same methods as in Gronow et al. (2020): the AREPO code (Springel 2010; Pakmor et al. 2016) employs a second-order finite-volume method in combination with a tree-based gravity solver to integrate the Euler-Poisson equations forward in time. Instead of the 33 isotope network of Gronow et al. (2020), we included 35 species in our nuclear network, now also accounting for 14N and 22Ne which represent the metallicity of the WD in the hydrodynamics simulations. It is comprised of n, p, 4He, 12C, 13N, 14N, 16O, 20Ne, 22Ne, 22Na, 23Na, 24Mg, 25Mg, 26Mg, 27Al, 28Si, 29Si, 30Si, 31P, 32S, 36Ar, 40Ca, 44Ti, 45Ti, 46Ti, 47V, 48Cr, 49Cr, 50Cr, 51Mn, 52Fe, 53Fe, 54Fe, 55Co, and 56Ni. One of our models with a particularly low He shell mass was calculated with a 55 isotope nuclear network, because in this case an extended network is required to capture the energy release more accurately (see Shen et al. 2018b; Townsley et al. 2019, for a detailed explanation). The details of the nuclear network are given in Sect. 4.7 of Gronow et al. (2020).
In our simplified treatment in the hydrodynamical explosion simulations, the metallicity was set by adding an appropriate amount of 22Ne in the core and 14N in the shell. The values were calculated based on solar metallicity (Asplund et al. 2009): All initial carbon and oxygen accumulates in 14N during CNO cycle hydrogen burning in the shell. In the core material, it is converted to 22Ne. The composition of the core was set to the mass fractions X(12C) = 0.5, X(16O) = 0.49 and X(22Ne) = 0.01; for the shell we used X(4He) = 0.997 and X(14N) = 0.003. A larger nuclear network in the hydrodynamic simulations would significantly increase the computational costs but not affect the dynamics of the explosions themselves. Detailed nucleosynthesis yields were instead determined in a postprocessing step based on tracer particles (Travaglio et al. 2004) with a much larger network.
For modeling detonations on the AREPO grid, burning was disabled inside the shock. A detailed description of the implementation can be found in Gronow et al. (2020) and follows Fryxell et al. (1989) and Appendix A in Townsley et al. (2016). It differs from the scheme of Kushnir & Katz (2020) who introduce a burning limiter for the modeling of thermonuclear detonation waves. The scaling factor employed in the limiting procedure is sensitive to the setup, and a detailed calibration is necessary which goes beyond our current work. Pakmor et al. (2021), however, investigate the effect of the burning limiter by Kushnir & Katz (2020) in AREPO simulations of mergers involving hybrid HeCO WDs. They find that their main simulation results do not dependent on the use of the burning limiter, and, therefore, our simulations were carried out with the implementation following Fryxell et al. (1989) and Townsley et al. (2016).
AREPO allows for adaptive mesh refinement. This was exploited here in all models in the same way as in Gronow et al. (2020): The He shell and the region where the He detonation wave converges opposite to its ignition spot have higher levels of refinement. The region at the antipode of the He ignition spot was found to be critical for the detection of the carbon detonation ignition mechanism by Gronow et al. (2020). Since the convergence region is located in the shell, this region has the highest level of refinement, followed by the He shell and the remaining WD at base resolution. A cell is refined based on where it is located. It is split when its mass exceeds a target mass by a prescribed factor as in Pakmor et al. (2013) and Gronow et al. (2020). A passive scalar was placed into the He shell to follow its location. We used the same reference mass of 2 × 1027 g as Gronow et al. (2020) for the base resolution. For each model the highest level of refinement was placed around the negative z-axis at 4 × 108 cm. The mass resolution in this region is included in Tables 1 and 2 at time t = 1 s after He ignition.
Overview of parameters for models with core masses of about 0.8 M⊙ and 0.9 M⊙.
Overview of parameters for models with a core mass of about 1.0 M⊙ and 1.1 M⊙.
2.2. Postprocessing
Following the explosion simulation, a postprocessing step was carried out. The evolution of temperature and density in the exploding WD was recorded by two million tracer particles with a mass of about 1 × 1027 g each, that were randomly distributed in the initial WD (see Travaglio et al. 2004). The tracer particles were used to determine the final yields and the chemical structure of the ejecta for subsequent radiative transfer calculations.
For the postprocessing step a nuclear reaction network with 384 nuclear species was used. To achieve a more accurate treatment of the metallicity in the WD, all elements heavier than fluorine were included as given in Asplund et al. (2009). We used the 2014 version of the REACLIB data base (Rauscher & Thielemann 2000) to include all relevant reaction rates. This is done using the same method as Pakmor et al. (2012).
3. Models
3.1. Model setup
The study in this paper comprises thirteen models. They cover different shell and core masses and range from 0.8 M⊙ to 1.1 M⊙ for the core and from 0.02 M⊙ to 0.1 M⊙ for the shell mass of the WD. The core mass limits correspond to low as well as high luminosity models (see Sim et al. 2010; Fink et al. 2010, for comparison). We further cover the highest expected He shell masses (Woosley & Kasen 2011; Neunteufel et al. 2016), but also reach down to low shell masses (e.g., Fink et al. 2010; Townsley et al. 2019). The core-shell mass ratio is a parameter that is not well constrained. It highly depends on the progenitor evolution and ignition process.
The initial models were created in the same way as described in Gronow et al. (2020). They were set up to be in hydrostatic equilibrium in 1D. For this, the total mass (Mtot) and the density (ρs) marking the transition between core and shell were chosen. These in turn determine the mass of the core (Mc) and shell (Ms) as well as central density (ρc). The core temperature Tc was set to a constant value of 3 × 10⁷ K. In the transition region between core and shell which spans over 1.8 × 106 cm the temperature changes linearly along with the composition. The temperature at the base of the He shell Ts was set to 6 × 10⁷ K. Beyond this point, the temperature declines adiabatically. The 1D profile was mapped to the 3D computational grid of AREPO using the HEALPix method (Górski et al. 2005) following the procedure of Ohlmann et al. (2017). The metallicity-dependent effect of the electron fraction Ye is implemented in this mapping step by adding 22Ne to the composition of the core material. This slight perturbation of the hydrostatic equilibrium is leveled off in the subsequent relaxation step (see Sect. 3.2).
The parameters of the pre-explosion models are given in Tables 1 and 2. These include the total mass of the WD (Mtot), the initial core mass (Mc_ini), and shell mass (Ms_ini) after the mapping to the 3D hydrodynamic grid. Grid cells with an initial He mass fraction of at least 0.01 are considered to be part of the shell. For completeness, the core temperature and density, and temperature and density at the base of the He shell are listed. The model names include the initial core and shell mass in the first two and last two digits, respectively. A WD with an 0.8 M⊙ core and 0.03 M⊙ shell initially is therefore named M08_03.
3.2. Relaxation and treatment of core - shell mixing
To remove spurious velocities that might occur due to the mapping of the 1D setup onto the 3D computational grid, a relaxation step according to Ohlmann et al. (2017) was carried out, as also implemented in Gronow et al. (2020). Spurious velocities were damped by the addition of a source term proportional to

to the momentum equation as stated in Eq. (8) of Ohlmann et al. (2017) with the damping timescale τ. The degree of damping was decreased during the relaxation step until eight dynamical timescales have passed. No damping was applied during the remaining relaxation time until ten dynamical time scales have passed. This allowed us to check for each model whether the stability criteria listed in Ohlmann et al. (2017) were met. The relaxation leads to additional mixing between the core and shell. We find that the amount of mixing primarily depends on the initial shell mass as the models with a similar initial shell mass show a good agreement in the shell composition after the relaxation. Because all grid cells with a helium mass fraction of at least 0.01 are considered to be part of the shell, the shell formally increases in mass during this step. The abundance profiles of 4He and 12C are shown in Fig. 1 for Models M10_10, M10_05, and M10_03 (see Table 2 for details). The profiles after relaxation (in black and magenta) have a much broader transition region between core and shell material. It is also visible that the base of the shell has moved further in during the relaxation. The compositions of shell and core after the relaxation are given in Tables 1 and 2 by M(4Hedet_s), M(12Cdet_s), M(14Ndet_s), M(16Odet_s), and M(22Nedet_s), as well as M(12Cdet_c), M(16Odet_c), and M(22Nedet_c), respectively. In our models, the degree of mixing between core and shell was set by the relaxation step, in addition to a small initial transition region in the 1D profile. In reality, this mixing depends on complex processes in the accretion phase and its strength is not known to date. Simulations of rotating WDs by Neunteufel et al. (2017) consider aspects such as dynamical shear instability, Goldreich-Schubert-Fricke instability and secular shear instability to model mixing appropriately (see Neunteufel et al. 2017, for details). The simulations show that the degree of mixing depends on many parameters. The strongest effect is seen with a change in total mass (less massive systems showing more mixing than massive systems). Due to the uncertainties of the exact mixing, the setup after relaxation is used as a first test.
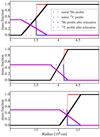 |
Fig. 1. Radial abundance profiles of 4He and 12C for Model M10_10, M10_05 and M10_03 from top to bottom; the initial profiles before relaxation are shown in red and blue, and the profiles after relaxation in black and magenta. |
The effect of core-shell mixing is analyzed in more detail with the consideration of two additional models, M08_10_r and M09_10_r, for which the composition was reset. After relaxing models M08_10 and M09_10, the composition is changed back to the initial profiles of the corresponding 1D setups (see Table 1 for the values). By comparing these de-mixed models to their counterparts in our standard setup, M08_10 and M09_10, we can assess the impact of the assumptions made for explosion dynamics and the derived nucleosynthetic yields. We note that the model parameters differ slightly in the standard and de-mixed setups: due to the relaxation procedure described above some core material is mixed into the shell causing the shell mass to increase and the core radius (defined as the maximum radius with a He mass fraction lower than 0.01) to decrease.
3.3. Detonation simulations
At the beginning of the explosion simulation, the He detonation was ignited artificially in one roughly spherical region around the radius of the peak in the temperature profile. The volume of the He detonation ignition region is included in Tables 1 and 2, and was set to have a previously set value. The He detonation was ignited by increasing the specific thermal energy around the temperature peak as explained in Gronow et al. (2020) and the location of the ignition spot was chosen to be on the positive z-axis with x = y = 0. The radial position of the center of the He detonation region is given in Tables 1 and 2. The evolution was followed for 100 s.
4. Results
Our parameter study covers a range of WD core and shell masses. In the following, we discuss the effect on the detonation ignition mechanism and final abundances.
4.1. Detonation ignition mechanism
The double detonation scenario consists of two detonations. The first detonation is in the He shell. Shen et al. (2010) and Glasner et al. (2018) describe a mechanism leading to He ignition: The shell material is heated by compression due to the accretion process and convection sets in. The material is unstable to convection, and temperature fluctuations develop because of convective burning. The He burning increases the temperature further, increasing the burning rates. In hotspots this results in a burning time scale shorter than the convective turn over time and dynamical time scale, and allows a detonation to develop. Shen & Moore (2014) investigate different sizes for hotspots as well as the effect of possible pollution of the material by carbon and oxygen.
Following its ignition, the He detonation propagates in the shell around the core driving a shock wave into the core. The He detonation converges on the far side of its ignition spot and a shock wave moves into the core. The shock waves converge off-center in the WD core at high densities of about 2.0 × 10⁷ g cm−3. At this point a core detonation is ignited which then burns through the whole star. This detonation mechanism is called the “converging shock scenario” (“cs” in the tables) (e.g., Livne 1990; Fink et al. 2007; Shen & Bildsten 2014).
However, there are a number of mechanisms that can ignite the core and have previously been discussed in the literature. In the “edge-lit scenario” (“edge”) (e.g., Livne & Glasner 1990), a core detonation is ignited at the core-shell interface directly after the ignition of the He detonation. A third mechanism is the “scissors scenario” (“s”) (Forcada et al. 2006; Gronow et al. 2020). In this case the convergence of the He detonation wave takes place in a carbon-enriched transition region between core and shell. It is strong enough to ignite carbon burning at this point, before the convergence of the shock waves in the core. We observe all three detonation ignition mechanisms. The mechanism of each model is listed in Tables 1 and 2.
The exact ignition mechanism of the core detonation depends on the specific setup of the WD. For example, the density at the base of the He shell is an important parameter for the edge-lit mechanism. The amount of carbon mixed into the shell and the details of the transition region between core and shell are also important, in particular for the scissors mechanism. The carbon detonation ignition is not fully resolved in the current simulations and the observed core ignition is at least in parts a numerical artifact. Katz & Zingale (2019) argue that a resolution of 1 km is needed. Kushnir & Katz (2020), in contrast, state that a 10 km resolution is sufficient when using their burning limiter. The cells showing a carbon ignition in our simulations have a radial extent of some 30 km assuming a sphere in our models. Therefore, we check whether sensible values for an ignition (Röpke et al. 2007; Seitenzahl et al. 2009) are reached. It is reasonable to trust the different mechanisms found in simulations if critical values are reached in large enough regions. With this additional constraint the core detonations can be interpreted as being physical, although this is not rigorously proven by our simulations.
A second, core detonation is observed in all models except for the model with the lowest He shell mass of initially 0.02 M⊙, M10_02, where a core detonation is not triggered. In this case, a core detonation is ignited artificially when the density and temperature reach values of at least 2.5 × 10⁷ g cm−3 and 8.0 × 10⁸ K, respectively. Townsley et al. (2019) have claimed a successful core detonation using a similar setup. We do not confirm this in our simulation, which can be caused by a lack of resolution. But in order to test the potential outcome in the case of a core detonation ignition, a carbon detonation is ignited once critical values found in Röpke et al. (2007) and Seitenzahl et al. (2009) are met. Since these values are reached in some cells, this indicates that a detonation ignition may be physical in this case. It shows that the artificial numerical ignition fails for this model. The ignition mechanism of the core detonation found for each model is listed in Tables 1 and 2, as well as the time of carbon ignition.
The edge-lit mechanism is found in the models with the highest masses, both for core and shell, M10_10 and M11_05. The propagation of the double detonation in Model M10_10 can be inferred from the evolution of the temperature as illustrated in the top row of Fig. 2. A comparison of the two leftmost panels shows that the carbon detonation is ignited shortly after the He detonation. By the time of the rightmost panel (0.7 s after He detonation ignition), the detonation has propagated through the whole core. The He detonation was ignited at the peak of the initial temperature profile. With 2.2 × 10⁶ g cm−3, the density at this point is the second highest of all models in our study (with only M11_05 reaching a higher value). Since the temperature is increased to values of at least 7.0 × 10⁸ K, it is sufficient to cause a carbon detonation in the transition region between core and shell. Livne & Glasner (1990) argue that the He detonation needs to be ignited at some altitude above the core-shell interface as the detonation needs some time to develop enough strength to ignite the core. In contrast, we find that the He detonation fades out if it is ignited further out. This is due to the lower density. However, the ignition spot is located 2.7 × 107 cm away from the base of the shell allowing the detonation to be strong enough for a carbon ignition.
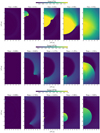 |
Fig. 2. Time evolution of Model M10_10, M10_05 and M08_03 from top to bottom showing the edge-lit, scissors and converging shock mechanism, respectively; temperature is given in K at different times increasing from left to right in a cut through the center of the WD showing only the positive x axis. |
The carbon detonation in Models M08_10_r, M09_10_r, and M10_05 is ignited via the scissors mechanism (see Gronow et al. 2020, for a detailed description). M10_05 is set up in the same way as Model M2a of Gronow et al. (2020). The only difference here is the solar metallicity of the stellar material in our new model. This leads to slight changes in the composition of the shell after the relaxation compared to Model M2a. These differences are, however, too small to affect or alter the ignition mechanism. After the He detonation is ignited (left panel of Fig. 2, second row) and propagates through the shell (second panel from left), carbon is ignited (central panel) at the interface between core and shell. Here the carbon mass fraction is at least 0.29 at a point with a density of 5.0 × 10⁶ g cm−3 and temperature of 2.5 × 10⁹ K which fulfills the detonation ignition conditions put forward in Röpke et al. (2007) and Seitenzahl et al. (2009).
The effect of mixing between core and shell on the carbon ignition mechanism is studied with the comparison of Models M08_10 and M08_10_r as well as M09_10 and M09_10_r (see Sect. 3.2 for details). The total (and shell) masses of M08_10 and M09_10 are among the highest in our parameter study. While the composition of the shell is comparable to M10_10, the He detonation burns at a much lower density which does not allow a direct ignition of the core as in M10_10. The models, instead, illustrate the importance of the details of the transition region and the degree of mixing between core and shell: It is observed that the He detonation burns at the very base of the shell. Because the composition changes over a large radial span in the transition of M08_10, it reaches regions with high enough 12C mass fraction and densities to ignite carbon already when the He detonation only propagated around two thirds of the WD. Following this, a carbon detonation moves into the core. In order to see whether this kind of carbon ignition can be physical, a higher resolution study of the transition region is required. This study goes beyond the scope of this work and will be carried out in the future. Furthermore, it is necessary to consider different sizes of the transition region, and with that different degrees of mixing, as the slope of the change in carbon abundance is an important parameter. A shallower change makes the propagation of the He detonation into higher density carbon enriched material easier.
Our results confirm that the details of the transition region are an important parameter for the carbon ignition as already stated in Gronow et al. (2020). M08_10_r has a thinner shell than M08_10 containing less carbon and corresponding to that a smaller transition region. Additionally, the density at the base of the He shell is lower, prohibiting a carbon detonation early at the interface. Instead, carbon is ignited by the scissors mechanism. The same behavior as found for M08_10_r can be observed in M09_10_r.
Four models, M08_05, M09_05, M09_03, and M10_03, show some burning of carbon producing heavy elements in the region where the He detonation wave converges at the antipode of the He detonation ignition spot. This is similar to the scissors mechanism and marked by “(s,)” in Tables 1 and 2. However, the burning is not strong enough for a core detonation to start. Instead, the shock wave converges off-center in the core before the convergence of the He detonation wave can ignite a successful carbon detonation. This core detonation follows the converging shock mechanism. Unlike M10_05 and M2a, the models have lower densities at the core-shell interface. Therefore, the conditions listed in Seitenzahl et al. (2009) are not reached for a successful carbon ignition. Only two cells match the conditions in M10_03. This is, however, not sufficient for an ignition in our numerical treatment. It is to be noted that we refer to the lowest critical values found in Seitenzahl et al. (2009) which indicates that they are too low for a carbon ignition in the setup of M10_03. The burning front propagates much slower in these models.
Model M08_03 does not show this behavior: The He detonation burns at the lowest density compared to the other models of the parameter study so that conditions to ignite carbon in the core–shell interface are not met at the antipode of the He ignition spot. Only the convergence of the shock wave in the core is strong enough to reach critical values and ignite a carbon detonation. Model M10_02 tests the limit of an extremely low-mass He shell. Here, all potential carbon ignition mechanisms fail. Even the central convergence of the shock wave in Model M10_02 is not strong enough for an ignition. A core detonation is rather ignited artificially (marked as “art cs” in Table 2) when critical values listed above are reached. In this case, values are attained for a physical ignition, but are not high enough to trigger a numerical carbon ignition in the AREPO code. However, it is possible that an ignition can be observed in a higher resolution simulation.
4.2. Final abundances
The nucleosynthetic yields of the explosion models as determined in the postprocessing step sensitively depend on the shell and core masses. The abundances of 4He, 12C, 16O, 28Si, 32S, 40Ca, 44Ti, 48Cr, 52Fe, 55Mn, 55Co, and 56Ni at 100 s after He ignition are given for all models in Tables 3–6. A detailed list of the nucleosynthesis yields can be found in Appendix A. In Tables A.1 and A.2 we list the final abundances of stable nuclides and radioactive nuclides with a lifetime less than 2 Gyr decayed to stability. Radioactive nuclides with a longer lifetime are given with the yields at t = 100 s. We further list the yields of selected radioactive nuclides at t = 100 s in Tables A.3 and A.4. The tables are created in the same way as in Seitenzahl et al. (2013). All abundances are given in solar masses.
Final abundances for Model M08_10, M08_10_r, M08_05 and M08_03.
Final abundances for Model M09_10, M09_10_r, M09_05 and M09_03.
Final abundances for Model M10_10, M10_05, M10_03 and M10_02.
Final abundances for Model M11_05.
The abundances of the He shell detonation are dominated by intermediate mass elements (IMEs). This is the case as they are produced in low density regions. We note that the shell detonation of models with the same shell mass, but different core mass, burn at different densities. This then leads to a different abundance distribution based on the individual density profile. In addition, the mixing of carbon into the shell during the relaxation influences the yields. The additional carbon isotopes stop burning following the α-chain at an earlier point so that less heavy elements are produced (see Yoon et al. 2004 and Gronow et al. 2020 for details). This is the case because an enhanced carbon abundance leads to a high 12C to α particle ratio. At the same time, some carbon present in the shell supports the production of heavy elements. Above a cross-over temperature the 12C(α, γ)16O reaction is faster than the triple-α reaction. Figure 5 in Gronow et al. (2020) shows the cross-over temperature depending on the carbon enhancement.
Since observations disfavor a large amount of 56Ni and other heavy elements such as titanium and chromium in the shell ejecta (Höflich et al. 1996; Fink et al. 2010; Kromer et al. 2010), only models with lower shell masses seem to be suitable candidates for reproducing normal SNe Ia. In our study they are represented by M08_03, M09_03, M10_03, and M10_02. All four models produce an amount between 9.9 × 10⁻⁷ M⊙ (M08_03) and 6.0 × 10⁻⁵ M⊙ (M10_03) of 56Ni in the shell detonation. The synthetic color light curves derived from the hydrodynamical simulation models are usually too red. This is a feature in part caused by the amount of 44 Ti that is produced in the double detonation. In our models the total amounts are between 2.3 × 10⁻⁴ M⊙ (M08_03) and 2.7 × 10⁻³ M⊙ (M08_05). A comparison of all models shows that more 56Ni is produced when the core mass and consequently the central density increases, as is expected because then more material is available at sufficiently high densities. The total 56Ni abundances of all models is in the expected range of a SNe Ia (e.g., Stritzinger et al. 2006).
As mentioned in Sect. 4.1, the shell of M08_10_r has the composition and mass of the initial setup before the relaxation. This change has an influence on the carbon detonation ignition. However, the nucleosynthetic yields of the core detonation are very similar to M08_10, though less 12C is burned in M08_10_r which can be explained by the larger core mass of M08_10_r due to the decreased amount of mixing. The shell detonation of M08_10_r results in a lower production of IMEs as expected. Instead more 56Ni is produced as the α-chain is not stopped early on by the presence of 12C. The 44Ti production is about the same in both models, the influence the admixture has on the observables is therefore only small and mostly due to 48Cr which is produced less in M08_10_r.
The final abundances of Model M10_05 can be compared to M2a of Gronow et al. (2020) since these have the same setup. While both models exhibit the same carbon detonation ignition mechanism, the slightly more massive shell and the solar metallicity of M10_05 only have a small effect on the nucleosynthesis yields. In both models about 0.01 M⊙ of carbon and oxygen are mixed into the shell. However, in our model the shell also contains 14N and 22Ne representing metallicity with 22Ne being present due to the mixing between core and shell. The production of IMEs in the shell detonation is higher in M10_05 as more 4He and 12C are burned. The abundance of 44Ti is of the same order of magnitude in both models. We note though that about 0.04 M⊙ less 56Ni are produced in total in M10_05. Instead more stable nickel isotopes are produced (Timmes et al. 2003; Kasen et al. 2009; Shen et al. 2018b). The changes of the total 56Ni and 58Ni abundances is due to the solar metallicity of M10_05 compared to zero metallicity of M2a. Lach et al. (2020) present a detailed discussion of the nucleosynthesis yields of M10_05 (M2a⊙ in Lach et al. 2020) and in part of M2a.
The spatial distribution of the nucleosynthesis yields in the ejecta sensitively depends on the detonation mechanism of the double detonation scenario. To illustrate this, Fig. 3 shows the mass fraction of 56Ni for Models M08_03, M10_05, and M10_10, that is models that exhibit the three different carbon ignition mechanisms. In M08_03 56Ni is only produced in the very center of the WD. The low core densities only allow burning to 56Ni at shock convergence and at the center. The temperature and density are too low for 56Ni production to take place in other regions. Figure 3b shows a close resemblance to Fig. 13 in Gronow et al. (2020). This is expected due to the similar setup of M2a and M10_05. In addition to the expected production of 56Ni in the core and to some degree in the shell, M10_05 also shows 56Ni at the convergence point of the He detonation wave where carbon is ignited in the scissors mechanism. We attribute this difference compared to M2a to the different density profiles. The density at the convergence point of M10_05 is higher than for M2a (maximum values of 1.2 × 10⁷ g cm−3 compared to 8.3 × 10⁶ g cm−3). The 56Ni production is more symmetric for Model M10_10. Here 56Ni is synthesized in the whole core as well as in the shell. The larger 56Ni amount in the shell compared to M10_05 is due to the increased shell mass and thus higher density at the base of the He shell. A small impact of the edge-lit detonation is visible as 56Ni is located close to the base of the shell on the positive z-axis and spread out more on the negative z-axis. The “wings” are a result of the shallow transition region: He is burning in the whole transition region propagating inward. When it reaches the core, it causes a second detonation wave to propagate through the core. However, as the core ignition is triggered before by the edge-lit mechanism this does not have a big influence on the abundances or evolution. A similar effect for M08_10 and M09_10 is discussed in Sect. 4.1. Its impact can potentially be decreased by igniting a smaller region in the artificial He detonation or by a different setup of the transition region. All models show a symmetry around the z-axis because of the position of the He detonation spot we chose.
 |
Fig. 3. Slice along the x-axis of Models M08_03 (left), M10_05 (center) and M10_10 (right) showing the 56Ni abundance in mass fraction for the converging shock, scissors and edge-lit mechanism, respectively. |
5. Discussion in the context of other works
Simulations of exploding sub-MCh WDs have previously been carried out by other groups, such as Livne & Arnett (1995), García-Senz et al. (1999), Fink et al. (2010), Moll & Woosley (2013), Blondin et al. (2017a), Tanikawa et al. (2018), Polin et al. (2019), and Leung & Nomoto (2020). A comparison is difficult in some cases as most models do not account for metallicity effects or the admixture of carbon into the He shell. Furthermore, our simulations are among the first to be carried out in full 3D (e.g., see Moll & Woosley 2013; Tanikawa et al. 2018).
Since M10_05 is set up in the same way as M2a in Gronow et al. (2020) a comparison to Model 3 of Fink et al. 2010 (FM3 hereafter) is also possible. The model by Fink et al. (2010) assumes zero metallicity of the progenitor material, and the shell in our model is more enriched in carbon. This carbon enhancement has an influence on the abundances (see Kromer et al. 2010; Gronow et al. 2020). The differences in both the 44Ti and the 48Cr yields from the shell detonation are, however, for the most part caused by the different numerical treatments as can be seen from the comparison of M1a and M2a with FM3 in Gronow et al. (2020). The 44Ti and 48Cr masses in our M10_05 model are lower than in FM3 and match values of M2a. The difference in the 44Ti mass is even one magnitude. Silicon and sulfur are produced more in our model, which is due to the larger amount of carbon in the helium shell, which causes the α-chain to terminate at IMEs. The differences in the yields from the shell detonation can in part be attributed to the use of the level-set method for modeling the detonation propagation assuming instantaneous burning of the fuel in Fink et al. (2010). It is not best suited to follow detonations at low densities, but is more accurate at the high densities encountered in the core. In contrast to the nucleosynthesis yields from the shell, the final yields from our core detonation are more similar to that found by Fink et al. (2010), with slight differences resulting from the different setups and numerical treatments.
The model presented in Tanikawa et al. (2018) also has a similar setup with a 0.95 M⊙ core and a 0.05 M⊙ shell. Their calculations are carried out with an SPH code in 3D considering a small nuclear network of 13 species in the hydrodynamics. They acknowledge some mixing between core and shell, but do not account for metallicity effects which is different to M10_05. We find a good agreement in the nucleosynthesis yields of the total amount of produced 56Ni and lighter IMEs (Si and S). The amount of unburnt oxygen matches as well. However, they find a slightly lower amount of 56Ni produced in the shell detonation which is due to the different shell masses.
Neunteufel et al. (2016) argue that the binary systems considered in their study cannot account for the majority of observed SNe Ia. Their models accrete 0.163 M⊙ on average until detonation. The He shell should rather be less massive as discussed by Woosley & Kasen (2011). They find a set of models that should result in normal SNe Ia spectra (see Table 1 in Neunteufel et al. 2016). Woosley & Kasen (2011) use the 1D Kepler code (Weaver et al. 1978; Woosley et al. 2002) to investigate different accretion rates and luminosities in connection with varying WD core masses. They find that more massive WDs have light curves like normal SNe Ia when they have only a small He shell. They further observe that less massive WDs accrete larger shells and that hot WDs develop lower shell masses than cold WDs. The range of core masses we consider in our study is also included in their parameter range. Out of the models that show a double detonation (either edge-lit or converging shock), seven models can be used for a comparison to our study. These are 10B, 10D, 8A, 10HB, 10HD, 9B, and 8HBC (for details see Woosley & Kasen 2011). A detailed discussion of the nucleosynthesis yields of all models goes beyond this work. Instead, we focus on only some aspects in the following. It needs to be considered that Woosley & Kasen (2011) do not account for metallicity effects in their work. The total yields of 56Ni are about the same in their models as in our models with a similar mass configuration (with two of our models producing less). Among the selected models 10B and 10HD are both similar to M10_05. Both produce about the same amount of 28Si, 32S, and 40Ca. Our model produces significantly less 44Ti, 48Cr, and 52Fe than either of the two which indicates that the color may not be as red as the ones of 10B and 10HD. However, the production of 55Co is higher in our model having an influence on the final manganese yields after its decay (see Lach et al. 2020, for a discussion on the effect manganese has on galactic chemical evolution). Of the two models, 10B matches our model slightly better as the discrepancy in the 56Ni production is not as big. Models 8A and 8HBC can be compared in the same way as they are similar to M08_10_r. Here 8A and M08_10_r are a good match in the yields of 56Ni, while we produce more 44Ti, 48Cr, and 55Co. On the other hand, 8HBC produces more 44Ti and 56Ni. A discussion of the difference between 8A and 8HBC is given by Woosley & Kasen (2011), we just mention that the initial luminosity is 100 times higher in 8HBC representing a hot WD and that the IME production in both models is almost the same. The differences between our models and the comparison models of Woosley & Kasen (2011) are caused by the details of the individual setups. Further, Woosley & Kasen (2011) only carry out 1D simulations. Transferring their setup to 2D or 3D would result in a He detonation that ignites in a shell and not just one point. The expansion of the material behind the detonation front is therefore different from ours. However, we note that their nuclear network includes up to about 500 species, with a base network of 19 isotopes, and adapts to the isotopes present in the time step. It should be sufficient to gain reliable nucleosynthesis yields.
Another parameter study was carried out by Polin et al. (2019). They consider a set of core and shell masses in 1D simulations. Their models account for some mixing taking place in a transition region between core and shell. Only the radial span of the transition and not its composition are listed. Therefore, a detailed comparison with our models is difficult as we consider all cells with an initial He mass fraction of at least 0.01 as part of the shell. Their models further do not include isotopes to represent metallicity. While Polin et al. (2019) carry out a postprocessing step including a larger network, their hydrodynamics simulations are considering only 21 isotopes. This low number is not best suited for low shell masses as pointed out by Shen & Moore (2014) and Townsley et al. (2019). Several of their models have a good agreement with our models with respect to the core and shell masses. These include models with a thin shell (a 1.0 M⊙ with a 0.02 M⊙ shell) as well as larger shells (such as a 0.8 M⊙ or 0.9 M⊙ core with a 0.08 M⊙ shell, or a 1.0 M⊙ with a 0.10 M⊙ shell). In all models it is visible that the total IME yields are slightly lower in our models, while in total more 56Ni is produced in some cases. However, we observe that the 56Ni abundance coming from the shell detonation is significantly lower in our models. Similar to Woosley & Kasen (2011) this is most likely due to the different numerical treatments as well as nuclear networks and the multidimensionality of our study. Polin et al. (2019) state that their models with a thin He shell better match some features of SNe Ia, such as characteristic spectral features. We discuss the spectral agreement of our models with observations in a follow-up paper.
Model M10_02 has a similar initial configuration as the model presented by Townsley et al. (2019). A detailed discussion is difficult as not all parameters of their model are given. However, we note that the core is slightly less massive in M10_02 as material is mixed into the shell during the relaxation step. The initial compositions of both models also show small differences. However, both include 14N and 22Ne at solar metallicity. Our model has a larger 56Ni production in the shell which is due to the higher densities in the shell as this allows to burn to heavier elements. The individual densities are in turn a result of the different initial temperature profiles. At the same time, a larger amount of 44Ti from the shell detonation in our model is caused by the stronger enrichment of carbon to the shell. The nucleosynthesis yields following the core detonation show a very good agreement. The discrepancy in the 56Ni yields can be explained by the relatively high amount of elements with Z ≤ 10 in Townsley et al. (2019). More 4He is burned to higher-mass elements in M10_02.
6. Synthetic observables
We carried out three-dimensional radiative transfer calculations, using the radiative transfer code ARTIS (Kromer & Sim 2009; Sim et al. 2007) to make predictions of the synthetic light curves for the explosion models. In this paper we present the model bolometric light curves. The model spectra at a sequence of time steps are integrated over frequency to generate the bolometric light curves. Each spectrum ranges from 600 − 30 000 Å. We discuss band-limited light curves, colors and spectra in a follow-up paper.
6.1. Angle-averaged bolometric light curves.
In this section we present the angle-averaged light curves for each of the models, and discuss the line of sight dependent light curves in Sects. 6.2 and 6.3. Since the models produce a range of masses of 56Ni, we expect the light curves to show a range of brightnesses, increasing in brightness with the mass of 56Ni. In Fig. 4 we show the angle-averaged bolometric light curves for each of the models. They demonstrate that the models indeed produce light curves showing a range of brightnesses, accounting for subluminous to normal brightness SNe Ia. The peak bolometric brightness varies significantly between the models, and ranges from −17.57 mag for our faintest model with the lowest mass of 56Ni to −19.28 mag for the brightest model with the highest mass of 56Ni (see Table 7). Apart from Model M10_05, the models show an increase in the mass of 56Ni with increasing model mass. Therefore, we find that the peak brightness increases with model mass, except for Model M10_05 which is fainter than Model M10_03. As the mass of 56Ni produced in Model M10_05 is less than Model M10_03 this is expected. However, this demonstrates that the light curve peak brightness is not determined solely from the initial core and shell masses, and that the detonation mechanism must be considered. We find that the peak brightness and bolometric decline rate, Δm15(bol), shown by Model M10_05 are similar to Model M10_02. These models produced the same mass of 56Ni in the core. We note that Model M2a shows a very similar peak bolometric magnitude to Model M10_05 (−18.93 and −18.92, respectively). These models have the same initial core and shell masses, and both show a secondary detonation by the scissors mechanism, but Model M2a has zero metallicity (see Table 2 for the metallicity of Model M10_05). The decline rate Δm15(bol) of Model M2a is, however, slower than Model M10_05 (0.71 compared to 0.88, see Table 7). This indicates that the model metallicity increases the rate of decline after maximum for this progenitor configuration, but the peak bolometric brightness does not change. As discussed in Sect. 4.2, the density at the base of the shell is slightly lower in Model M10_05 than in Model M2a, and this difference in the density structure leads to a higher production of IMEs and lower production of 56Ni in the shell detonation of Model M10_05. It is likely that the lower masses of heavy elements produced in the shell detonation when metallicity is considered leads to lower opacities and hence a faster decline rate. Model M2a shows a slower decline rate than all of the models in this parameter study, which further supports that metallicity increases the bolometric decline rate.
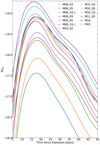 |
Fig. 4. Angle-averaged bolometric light curves. For comparison we also show Model M2a from Gronow et al. (2020) and Model 3 from Fink et al. 2010 (FM3). |
Parameters of the model angle-averaged bolometric light curves.
6.2. Line of sight bolometric light curves
The double detonation scenario predicts an asymmetric distribution of 56Ni in the explosion ejecta. This is shown in Fig. 3 for models exhibiting each of the three detonation scenarios found in this study (converging shock, scissors, and edge-lit). For these three models (M08_03, M10_05, and M10_10) we show the light curves in the lines of sight viewing toward the northern pole (i.e., in the direction of the initial He detonation, θ = 0°), toward the equator (θ = 90°), and toward the southern pole (θ = 180°) in Fig. 5. At maximum light, all of the models show angle-dependent light curves, but over time the level of angle-dependence decreases. As the ejecta become optically thinner with time, we find that the dependence on the viewing angle decreases. For the M08_03 and M10_05 models (showing secondary detonations by the converging shock, and scissors mechanisms, respectively), the brightest line of sight is in the direction toward the southern pole (θ = 180°). In the converging shock and scissors scenarios, the line of sight at θ = 180° has the highest mass of 56Ni produced nearest to the surface of the ejecta, as can be seen in Fig. 3. For the progenitor configuration considered for Model M08_03, the equatorial line of sight is similar to the line of sight at θ = 0° in bolometric light. This can also be explained by the distribution of 56Ni, as similar amounts are produced in these lines of sight. For a larger shell mass, however, the differences in these lines of sight are greater (see Fig. 6). In Model M10_05, the 56Ni synthesized in the core detonation is closer to the surface of the ejecta in the equatorial line of sight (θ = 90°) than in the line of sight at θ = 0°. Therefore, the light curve at θ = 90° is brighter than at θ = 0°. In Model M10_10, however, the brightest line of sight is viewing toward the northern pole (θ = 0°). In the edge-lit scenario, the core detonation is ignited on the same side of the core as the initial helium ignition. Therefore, it is in this line of sight that the 56Ni synthesized in the core detonation is nearest to the ejecta surface (see Fig. 3, where the outer ejecta are indicated by the outer ring of 56Ni produced in the shell detonation). The difference in brightness between the most extreme lines of sight is similar to that found for Model M10_05. Therefore, we find that strong asymmetries are expected in the light curves for the double detonation scenario when considering the converging shock, the scissors, and the edge-lit mechanisms.
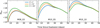 |
Fig. 5. Bolometric line of sight dependent light curves for models M08_03 (converging shock), M10_05 (scissors), and M10_10 (edge-lit). |
6.3. Bolometric width-luminosity
To show the level of asymmetry in each of our models, we plot the maximum bolometric magnitude against the bolometric decline rate over 15 days after bolometric maximum, Δm15(bol), and show this for 100 different viewing angles in each model (Fig. 6). We also show the angle-averaged values. It is clear that the angle-averaged values do not well represent the true range of light curves produced by each of these models. This highlights that the double detonation scenario is a fundamentally multidimensional problem, and that to understand it multidimensional simulations are required.
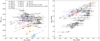 |
Fig. 6. Left: peak bolometric magnitude plotted against Δm15(bol). Right: bolometric decline rate over 40 days, Δm40(bol), plotted against the decline rate over 15 days, Δm15(bol). We show the angle-averaged light curve values (circles) and 100 different viewing angles (x) for each model. We include Model M2a (Gronow et al. 2020) for comparison. The error bars show the standard deviation of the viewing angle distributions. We also plot the bolometric dataset of Scalzo et al. (2019). |
We find that within a model, the lines of sight tend to show an increasing Δm15(bol) with increasing peak bolometric magnitude. In brighter lines of sight, the 56Ni is nearer the surface of the explosion ejecta, leading to a brighter maximum, but then a faster decline from maximum. In fainter lines of sight, the 56Ni is deeper in the ejecta and the energy takes longer to diffuse outward, hence, we find a fainter light curve that does not fade as quickly.
The angle-averaged bolometric peak brightnesses increase with the total mass of 56Ni produced by the model. However, the peak brightnesses in a given line of sight do not necessarily increase with the total model mass of 56Ni, as can be seen in Fig. 6. Model M2a shows similar bolometric peak brightnesses to Model M10_05, as expected given that these models had the same initial masses, and both showed a secondary detonation by the scissors mechanism. However, we find that for all lines of sight, the bolometric decline rate for Model M2a is slower. Again, this indicates that when the model metallicity is zero, we find a slower bolometric decline from maximum. Due to the inclusion of 14N and 22Ne in Model M10_05, representing the model metallicity, the density at the base of the shell is slightly lower in Model M10_05 than in Model M2a. The difference in the density structure results in the higher production of IMEs and lower production of heavy Fe-group elements in Model M10_05. The higher abundance of heavy Fe-group elements in Model M2a is likely responsible for the slower decline rate found for Model M2a compared to Model M10_05.
6.4. Comparison to bolometric data
In this section, we make comparisons to the bolometric dataset constructed by Scalzo et al. (2019) from well observed SNe Ia. While band-limited light curves provide much more accurate measurements of the data than constructing bolometric light curves, band-limited light curves are challenging to simulate since these require accurate calculations of the ejecta temperatures and ionization states, and are more sensitive to approximations made in the radiative transfer calculations. Bolometric light curves show the total radiant energy emitted as a function of time. This is dependent on the energy deposition rate, primarily from the radioactive decays of 56Ni, and the global opacity of the ejecta, and therefore is less sensitive to these approximations. A comparison to bolometric data provides an excellent initial test for how well our models agree with observations, while reducing the uncertainties arising from approximations made in the radiative transfer calculations. Scalzo et al. (2019) found a weak bolometric width-luminosity relation. We plot the bolometric peak magnitudes and bolometric decline rates Δm15(bol) from their sample in Fig. 6. Our brighter models lie in the same parameter space as the bolometric data. However, the distribution shown by the line of sight dependent values appears to be broader than the spread shown by the bolometric data. The brighter models may loosely follow the observed trend of the data, while our models extend to lower brightnesses and do not account for the brighter SNe Ia. The sample of bolometric data includes both overluminous and subluminous SNe Ia. The 1991bg-like SN 2006gt and SN 2007ba are included in the sample, representing the faint end of observed SNe Ia. Our faintest model is ∼0.8 mag fainter than the faintest SNe Ia in that sample, and all of the fainter models in our parameter study decline too slowly compared to the data. Models M08_03 and M08_05 lie outside the parameter space of the observed data, both in peak brightness and in decline rate. This is similar to the findings of Shen et al. (2018b), who found their low mass 0.8 M⊙ pure detonation model (CO white dwarf without a He shell) did not appear to match any observed SNe Ia. Shen et al. (2018b) suggested this may be associated with a minimum white dwarf mass, following a discussion by Shen & Bildsten (2014) indicating that the central density may be too low to ignite a secondary detonation by the converging shock mechanism. While we did find that in Models M08_03 and M08_05 secondary detonations were ignited by the converging shock mechanism, we also find that they do not resemble observations of SNe Ia in bolometric peak brightness and decline rate. This is also in agreement with Blondin et al. (2017b), who found that their low mass (0.88 M⊙) pure detonation model showed an anti-width-luminosity relation.
Scalzo et al. (2019) found a strong correlation between Δm15(bol) and Δm40(bol). In the right plot of Fig. 6, we show this correlation for the observed SNe Ia, compared to our models. The angle-averaged model parameters show a weak trend. However, the line of sight parameters show a clear correlation between Δm15(bol) and Δm40(bol). The models are, nevertheless, offset from the observed trend shown by the data. The light curve behavior at 40 days after maximum is driven by γ-ray opacity, dependent on ejecta mass and velocity. Our models predict that the bolometric light curves decline too quickly over 40 days compared to the data, indicating that the optical depth is too low. This implies that our model masses may be too low, or our ejecta velocities or composition is not in agreement with SNe Ia. This is similar to the findings of Kushnir et al. (2020) and Sharon & Kushnir (2020) who showed that models fail to reproduce the observed γ-ray escape time t0 to 56Ni mass relation, and in particular, luminous sub-MCh models (56Ni mass > 0.5 M⊙) predict values of t0 ≈ 30 days, which is lower than the observed SNe Ia values of t0 = 35 − 45 days. The models we consider in this work show similarly low values of t0. However, Wygoda et al. (2019) argue that sub-MCh models are a better match to observations than MCh models.
7. Conclusions
In this paper we presented full 3D simulations of double detonations in WDs with varying core and He shell masses. The range of the study was chosen to include low as well as high luminosity models. The core mass lies between 0.8 M⊙ and 1.1 M⊙, while the shell has a mass between 0.02 M⊙ and 0.1 M⊙. Looking into these different shell masses allowed us to investigate their influence on the final yields coming from the shell detonation. This is especially interesting as the He shell burning products cause problems with the observables (Höflich et al. 1996; Kromer et al. 2010). Not only the shell mass, but also the temperature profile and its effect on the resulting density profile, the shell composition (especially C admixture which suppresses the production of heavy elements and metallicity) and the dimensionality of the model are important. A key parameter is also the method used to follow the detonation, as well as the size of the network used in the detonation simulations as pointed out by Shen et al. (2018b) and Townsley et al. (2019). While the degree of mixing is an unknown parameter and should be determined with better confidence, our models indicate that the effect on the observables is low based on the small effect it has on the nucleosynthetic abundances.
Most previous studies were not carried out in 3D, but 1D (e.g., Bildsten et al. 2007; Polin et al. 2019) or 2D (e.g., Fink et al. 2007, 2010; Leung & Nomoto 2020). Often the core and shell masses are chosen differently from our models as well. In this context, we note that the mass configuration of core and shell in the detonation simulation was not set by us, but instead partly a result of a numerical relaxation step. Our models match some of the models of Woosley & Kasen (2011) and Polin et al. (2019) relatively well. This is independent of whether the core detonation ignition is the same or not as in Woosley & Kasen (2011). Our models are potentially a better match to observations than models by Polin et al. (2019) since less 56Ni is produced in the shell detonation. A comparison to the models of Woosley & Kasen (2011) and Polin et al. (2019) also shows the effect of multidimensional simulations and metallicity.
The hydrodynamic treatment is different to previous work by Fink et al. (2007, 2010) who use a level-set approach to follow the detonation in a parameterized model, where the energy release in the burning has to be calibrated. This introduces uncertainties. In our new models, the detonation is followed self-consistently by coupling a nuclear reaction network to the hydrodynamics. While the level-set approach has advantages when modeling deflagration flames, our new approach seems more reliable when following detonations, although they are not fully resolved and the detonation structure is artificially broadened. Moreover, the ignition of the core detonation arises spontaneously instead of being put in by hand. While numerical effects may dominate the detonation ignition mechanism in our new models, the thermodynamic conditions encountered in the ignition region justify it in retrospect. Despite these differences and the superiority of the new numerical treatment, the overall nucleosynthetic results of our new models agree with the previous studies of Fink et al. (2010). This shows that the treatment of detonations with a calibrated level-set approach performs surprisingly well. Our study finds varying carbon detonation ignition mechanisms. They do not have a strong influence on the nucleosynthetic yields, but they leave an imprint on the morphology of the ejecta.
The comparison of Model M10_05 to M2a from Gronow et al. (2020) illustrates the effect of metallicity on the final abundances in more detail. The production of IMEs is higher in the shell detonation at solar metallicity as the density profile is different. Furthermore, the core detonation produces more stable isotopes of Ni. The 44Ti abundances do, however, not change significantly.
A detailed discussion of the synthetic observables will be presented in a follow-up paper. In this work, we have discussed the bolometric properties of our models. The explosion models produce a range of masses of 56Ni, and therefore show a range of peak brightnesses, able to account for subluminous to normal SNe Ia brightnesses. The peak brightness of the models increases with 56Ni mass, but it does not necessarily increase with the model mass.
Model M10_05 and Model M2a have similar progenitor configurations. However, Model M2a has zero metallicity. Comparing these models shows that the consideration of the metallicity of the zero-age main sequence progenitor impacts the rate of decline shown by the light curves. We found that Model M2a has the slowest decline rate of all our models. This shows that metallicity affects the predicted synthetic observables. Future work will investigate the sensitivity to the chosen model metallicity.
The models again show that double detonations have a strong angle dependency. This was previously discussed by Gronow et al. (2020). We find that this is the case for all of our models. All three core detonation mechanisms found in this study (converging shock, scissors, and edge-lit mechanism) produce highly asymmetric ejecta profiles. Therefore, when making predictions of the double detonation scenario, multidimensional simulations are required. Angle-averaged light curves are not a good representation of the true predicted observables in a specific line of sight. The viewing angle effects on the bolometric light curves are predominantly the result of the distribution of 56Ni in the ejecta. Lines of sight where the 56Ni is closer to the ejecta surface show brighter light curves.
We compared our parameter study models to the bolometric data set of Scalzo et al. (2019) and found that our brighter models lie in the same parameter space as the fainter end of the observed bolometric width-luminosity relation. However, our faintest models are fainter than all SNe Ia in the sample. We also find that the distribution of the line of sight dependent values shown by our models is broader than the sample of SNe Ia. The bolometric data set shows a strong correlation between Δm15(bol) and Δm40(bol). Our models show a similarly strong correlation when considering the line of sight specific values. However, we find that the models are offset from the data, showing Δm40(bol) faster than the SNe Ia. Since the light curve behavior at 40 days after maximum is driven by γ-ray opacity, these results indicate that the model opacity is lower than that of SNe Ia and suggest that the model masses may be too low, or the ejecta velocities or composition is not in agreement with SNe Ia. This points to potentially generic problems of sub-Chandrasekhar mass WD explosions as models for SNe Ia, similar to those discussed by Kushnir et al. (2020) and Sharon & Kushnir (2020). However, as illustrated by Gronow et al. (2020), the models remain promising for accounting for lower luminosity and/or spectroscopically peculiar events. Further discussion of the comparison of our models to data, including spectra and band light curves, will be presented in a companion paper (Collins et al., in prep.).
Acknowledgments
This work was supported by the Deutsche Forschungsgemeinschaft (DFG, German Research Foundation) – Project-ID 138713538 – SFB 881 (“The Milky Way System”, subproject A10), by the ChETEC COST Action (CA16117), and by the National Science Foundation under Grant No. OISE-1927130 (IReNA). SG and FKR acknowledge support by the Klaus Tschira Foundation. SG thanks Florian Lach for helpful discussions. NumPy and SciPy (Oliphant 2007), IPython (Pérez & Granger 2007), and Matplotlib (Hunter 2007) were used for data processing and plotting. The authors gratefully acknowledge the Gauss Centre for Supercomputing e.V. (www.gauss-centre.eu) for funding this project by providing computing time on the GCS Supercomputer JUWELS (Jülich Supercomputing Centre 2019) at Jülich Supercomputing Centre (JSC). This work was performed using the Cambridge Service for Data Driven Discovery (CSD3), part of which is operated by the University of Cambridge Research Computing on behalf of the STFC DiRAC HPC Facility (www.dirac.ac.uk). The DiRAC component of CSD3 was funded by BEIS capital funding via STFC capital grants ST/P002307/1 and ST/R002452/1 and STFC operations grant ST/R00689X/1. DiRAC is part of the National e-Infrastructure. This research was undertaken with the assistance of resources from the National Computational Infrastructure (NCI Australia), an NCRIS enabled capability supported by the Australian Government.
References
- Asplund, M., Grevesse, N., Sauval, A. J., & Scott, P. 2009, ARA&A, 47, 481 [NASA ADS] [CrossRef] [Google Scholar]
- Belczynski, K., Bulik, T., & Ruiter, A. J. 2005, ApJ, 629, 915 [Google Scholar]
- Bildsten, L., Shen, K. J., Weinberg, N. N., & Nelemans, G. 2007, ApJ, 662, L95 [Google Scholar]
- Blondin, S., Dessart, L., & Hillier, D. J. 2017a, MNRAS, 474, 3931 [Google Scholar]
- Blondin, S., Dessart, L., Hillier, D. J., & Khokhlov, A. M. 2017b, MNRAS, 470, 157 [Google Scholar]
- Dave, P., Kashyap, R., Fisher, R., et al. 2017, ApJ, 841, 58 [Google Scholar]
- Fink, M., Hillebrandt, W., & Röpke, F. K. 2007, A&A, 476, 1133 [NASA ADS] [CrossRef] [EDP Sciences] [Google Scholar]
- Fink, M., Röpke, F. K., Hillebrandt, W., et al. 2010, A&A, 514, A53 [NASA ADS] [CrossRef] [EDP Sciences] [Google Scholar]
- Forcada, R., Garcia-Senz, D., & José, J. 2006, International Symposium on Nuclear Astrophysics - Nuclei in the Cosmos [Google Scholar]
- Fryxell, B. A., Müller, E., & Arnett, W. D. 1989, Hydrodynamics and nuclear burning, MPA Green Report 449 (Garching: Max-Planck-Institut für Astrophysik) [Google Scholar]
- García-Senz, D., Bravo, E., & Woosley, S. E. 1999, A&A, 349, 177 [NASA ADS] [Google Scholar]
- Glasner, S. A., Livne, E., Steinberg, E., Yalinewich, A., & Truran, J. W. 2018, MNRAS, 476, 2238 [Google Scholar]
- Górski, K. M., Hivon, E., Banday, A. J., et al. 2005, ApJ, 622, 759 [NASA ADS] [CrossRef] [Google Scholar]
- Gronow, S., Collins, C., Ohlmann, S. T., et al. 2020, A&A, 635, A169 [CrossRef] [EDP Sciences] [Google Scholar]
- Guillochon, J., Dan, M., Ramirez-Ruiz, E., & Rosswog, S. 2010, ApJ, 709, L64 [Google Scholar]
- Hillebrandt, W., Kromer, M., Röpke, F. K., & Ruiter, A. J. 2013, Front. Phys., 8, 116 [Google Scholar]
- Hoeflich, P., Wheeler, J. C., & Khokhlov, A. 1998, ApJ, 492, 228 [Google Scholar]
- Höflich, P., Khokhlov, A., Wheeler, J. C., et al. 1996, ApJ, 472, L81 [Google Scholar]
- Hunter, J. D. 2007, Comput. Sci. Eng., 9, 90 [NASA ADS] [CrossRef] [Google Scholar]
- Iben, I., Jr, Nomoto, K., Tornambe, A., & Tutukov, A. V. 1987, ApJ, 317, 717 [Google Scholar]
- Jülich Supercomputing Centre 2019, J. Large-scale Res. Facil., 5 [Google Scholar]
- Kasen, D., Röpke, F. K., & Woosley, S. E. 2009, Nature, 460, 869 [Google Scholar]
- Kashyap, R., Fisher, R., García-Berro, E., et al. 2015, ApJ, 800, L7 [Google Scholar]
- Katz, M. P., & Zingale, M. 2019, ApJ, 874, 169 [Google Scholar]
- Kromer, M., & Sim, S. A. 2009, MNRAS, 398, 1809 [Google Scholar]
- Kromer, M., Sim, S. A., Fink, M., et al. 2010, ApJ, 719, 1067 [Google Scholar]
- Kromer, M., Ohlmann, S., & Röpke, F. K. 2017, Mem. Soc. Astron. It., 88, 312 [NASA ADS] [Google Scholar]
- Kushnir, D., & Katz, B. 2020, MNRAS, 493, 5413 [Google Scholar]
- Kushnir, D., Wygoda, N., & Sharon, A. 2020, MNRAS, 499, 4725 [Google Scholar]
- Lach, F., Roepke, F. K., Seitenzahl, I. R., et al. 2020, A&A, 644, A118 [CrossRef] [EDP Sciences] [Google Scholar]
- Leung, S.-C., & Nomoto, K. 2020, ApJ, 888, 80 [Google Scholar]
- Liu, D., Wang, B., & Han, Z. 2018, MNRAS, 473, 5352 [Google Scholar]
- Livio, M., & Mazzali, P. 2018, Phys. Rep., 736, 1 [NASA ADS] [CrossRef] [Google Scholar]
- Livne, E. 1990, ApJ, 354, L53 [Google Scholar]
- Livne, E., & Arnett, D. 1995, ApJ, 452, 62 [Google Scholar]
- Livne, E., & Glasner, A. S. 1990, ApJ, 361, 244 [Google Scholar]
- Maoz, D., Mannucci, F., & Nelemans, G. 2014, ARA&A, 52, 107 [NASA ADS] [CrossRef] [Google Scholar]
- Moll, R., & Woosley, S. E. 2013, ApJ, 774, 137 [Google Scholar]
- Neunteufel, P., Yoon, S. C., & Langer, N. 2016, A&A, 589, A43 [NASA ADS] [CrossRef] [EDP Sciences] [Google Scholar]
- Neunteufel, P., Yoon, S.-C., & Langer, N. 2017, A&A, 602, A55 [NASA ADS] [CrossRef] [EDP Sciences] [Google Scholar]
- Nugent, P., Baron, E., Branch, D., Fisher, A., & Hauschildt, P. H. 1997, ApJ, 485, 812 [Google Scholar]
- Ohlmann, S. T., Röpke, F. K., Pakmor, R., & Springel, V. 2017, A&A, 599, A5 [NASA ADS] [CrossRef] [EDP Sciences] [Google Scholar]
- Oliphant, T. E. 2007, Comput. Sci. Eng., 9, 10 [Google Scholar]
- Pakmor, R., Kromer, M., Röpke, F. K., et al. 2010, Nature, 463, 61 [Google Scholar]
- Pakmor, R., Hachinger, S., Röpke, F. K., & Hillebrandt, W. 2011, A&A, 528, A117 [NASA ADS] [CrossRef] [EDP Sciences] [Google Scholar]
- Pakmor, R., Edelmann, P., Röpke, F. K., & Hillebrandt, W. 2012, MNRAS, 424, 2222 [Google Scholar]
- Pakmor, R., Kromer, M., Taubenberger, S., & Springel, V. 2013, ApJ, 770, L8 [Google Scholar]
- Pakmor, R., Springel, V., Bauer, A., et al. 2016, MNRAS, 455, 1134 [Google Scholar]
- Pakmor, R., Zenati, Y., Perets, H. B., & Toonen, S. 2021, MNRAS, 503, 4734 [Google Scholar]
- Pérez, F., & Granger, B. E. 2007, Comput. Sci. Eng., 9, 21 [Google Scholar]
- Phillips, M. M. 1993, ApJ, 413, L105 [NASA ADS] [CrossRef] [Google Scholar]
- Phillips, M. M., Lira, P., Suntzeff, N. B., et al. 1999, AJ, 118, 1766 [Google Scholar]
- Pinto, P. A., & Eastman, R. G. 2000, ApJ, 530, 744 [Google Scholar]
- Piro, A. L., Thompson, T. A., & Kochanek, C. S. 2014, MNRAS, 438, 3456 [Google Scholar]
- Polin, A., Nugent, P., & Kasen, D. 2019, ApJ, 873, 84 [Google Scholar]
- Rauscher, T., & Thielemann, F.-K. 2000, At. Data Nucl. Data Tables, 75, 1 [Google Scholar]
- Rebassa-Mansergas, A., Toonen, S., Korol, V., & Torres, S. 2019, MNRAS, 482, 3656 [Google Scholar]
- Röpke, F. K., & Sim, S. A. 2018, Space Sci. Rev., 214, 72 [Google Scholar]
- Röpke, F. K., Woosley, S. E., & Hillebrandt, W. 2007, ApJ, 660, 1344 [Google Scholar]
- Ruiter, A. J., Belczynski, K., & Fryer, C. 2009, ApJ, 699, 2026 [NASA ADS] [CrossRef] [Google Scholar]
- Scalzo, R. A., Parent, E., Burns, C., et al. 2019, MNRAS, 483, 628 [Google Scholar]
- Seitenzahl, I. R., Meakin, C. A., Townsley, D. M., Lamb, D. Q., & Truran, J. W. 2009, ApJ, 696, 515 [Google Scholar]
- Seitenzahl, I. R., Ciaraldi-Schoolmann, F., Röpke, F. K., et al. 2013, MNRAS, 429, 1156 [Google Scholar]
- Sharon, A., & Kushnir, D. 2020, Res. Notes Am. Astron. Soc., 4, 158 [Google Scholar]
- Shen, K. J., & Bildsten, L. 2014, ApJ, 785, 61 [Google Scholar]
- Shen, K. J., & Moore, K. 2014, ApJ, 797, 46 [Google Scholar]
- Shen, K. J., Kasen, D., Weinberg, N. N., Bildsten, L., & Scannapieco, E. 2010, ApJ, 715, 767 [Google Scholar]
- Shen, K. J., Boubert, D., Gänsicke, B. T., et al. 2018a, ApJ, 865, 15 [Google Scholar]
- Shen, K. J., Kasen, D., Miles, B. J., & Townsley, D. M. 2018b, ApJ, 854, 52 [Google Scholar]
- Shigeyama, T., Nomoto, K., Yamaoka, H., & Thielemann, F. 1992, ApJ, 386, L13 [Google Scholar]
- Sim, S. A., Sauer, D. N., Röpke, F. K., & Hillebrandt, W. 2007, MNRAS, 378, 2 [Google Scholar]
- Sim, S. A., Röpke, F. K., Hillebrandt, W., et al. 2010, ApJ, 714, L52 [Google Scholar]
- Sim, S. A., Röpke, F. K., Kromer, M., et al. 2013a, in IAU Symposium, eds. R. Di Stefano, M. Orio, M. Moe, et al., IAU Symp., 281, 267 [Google Scholar]
- Sim, S. A., Seitenzahl, I. R., Kromer, M., et al. 2013b, MNRAS, 436, 333 [Google Scholar]
- Soker, N. 2019, New Astron. Rev., 87 [Google Scholar]
- Springel, V. 2010, MNRAS, 401, 791 [NASA ADS] [CrossRef] [Google Scholar]
- Stritzinger, M., Mazzali, P. A., Sollerman, J., & Benetti, S. 2006, A&A, 460, 793 [NASA ADS] [CrossRef] [EDP Sciences] [Google Scholar]
- Tanikawa, A., Nomoto, K., & Nakasato, N. 2018, ApJ, 868, 90 [Google Scholar]
- Timmes, F. X., & Swesty, F. D. 2000, ApJS, 126, 501 [Google Scholar]
- Timmes, F. X., Brown, E. F., & Truran, J. W. 2003, ApJ, 590, L83 [Google Scholar]
- Toonen, S., Nelemans, G., & Portegies Zwart, S. 2012, A&A, 546, A70 [NASA ADS] [CrossRef] [EDP Sciences] [Google Scholar]
- Townsley, D. M., Miles, B. J., Timmes, F. X., Calder, A. C., & Brown, E. F. 2016, ApJS, 225, 3 [Google Scholar]
- Townsley, D. M., Miles, B. J., Shen, K. J., & Kasen, D. 2019, ApJ, 878, L38 [Google Scholar]
- Travaglio, C., Hillebrandt, W., Reinecke, M., & Thielemann, F.-K. 2004, A&A, 425, 1029 [NASA ADS] [CrossRef] [EDP Sciences] [Google Scholar]
- Tutukov, A., & Yungelson, L. 1996, MNRAS, 280, 1035 [Google Scholar]
- Weaver, T. A., Zimmerman, G. B., & Woosley, S. E. 1978, ApJ, 225, 1021 [Google Scholar]
- Webbink, R. F. 1984, ApJ, 277, 355 [Google Scholar]
- Whelan, J., & Iben, I. J. 1973, ApJ, 186, 1007 [Google Scholar]
- Woosley, S. E., & Kasen, D. 2011, ApJ, 734, 38 [Google Scholar]
- Woosley, S. E., & Weaver, T. A. 1994, ApJ, 423, 371 [Google Scholar]
- Woosley, S. E., Heger, A., & Weaver, T. A. 2002, Rev. Mod. Phys., 74, 1015 [NASA ADS] [CrossRef] [Google Scholar]
- Woosley, S. E., Kerstein, A. R., & Aspden, A. J. 2011, ApJ, 734, 37 [Google Scholar]
- Wygoda, N., Elbaz, Y., & Katz, B. 2019, MNRAS, 484, 3941 [Google Scholar]
- Yoon, S., Langer, N., & Scheithauer, S. 2004, A&A, 425, 217 [NASA ADS] [CrossRef] [EDP Sciences] [Google Scholar]
Appendix A: Abundances tables
We list the nucleosynthesis yields of all our models in Tables A.1A.4. Tables A.1 and A.2 list the stable nuclides, radioactive nuclides with lifetimes lower than 2 Gyr decayed to stability and radioactive nuclides with longer lifetimes at time t = 100 s. Nucleosynthesis yields of selected radioactive nuclides at t = 100 s are listed in Tables A.3 and A.4. Only a small part of the data is given here. The full tables are available in electronic form at the CDS.
Asymptotic nucleosynthesis yields for Models M08_10_r, M08_05, M08_03, M09_10_r, M09_05, and M09_03 (in solar masses).
Asymptotic nucleosynthesis yields for Models M10_10, M010_05, M10_03, M10_02, and M11_05 (in solar masses).
Nucleosynthesis yields for select radioactive nuclides of Models M08_10_r, M08_05, M08_03, M09_10_r, M09_05, and M09_03 (in solar masses).
Nucleosynthesis yields for select radioactive nuclides for Models M10_10, M10_05, M10_03, M10_02, and M11_05 (in solar masses).
All Tables
Asymptotic nucleosynthesis yields for Models M08_10_r, M08_05, M08_03, M09_10_r, M09_05, and M09_03 (in solar masses).
Asymptotic nucleosynthesis yields for Models M10_10, M010_05, M10_03, M10_02, and M11_05 (in solar masses).
Nucleosynthesis yields for select radioactive nuclides of Models M08_10_r, M08_05, M08_03, M09_10_r, M09_05, and M09_03 (in solar masses).
Nucleosynthesis yields for select radioactive nuclides for Models M10_10, M10_05, M10_03, M10_02, and M11_05 (in solar masses).
All Figures
|
Fig. 1. Radial abundance profiles of 4He and 12C for Model M10_10, M10_05 and M10_03 from top to bottom; the initial profiles before relaxation are shown in red and blue, and the profiles after relaxation in black and magenta. |
| In the text | |
|
Fig. 2. Time evolution of Model M10_10, M10_05 and M08_03 from top to bottom showing the edge-lit, scissors and converging shock mechanism, respectively; temperature is given in K at different times increasing from left to right in a cut through the center of the WD showing only the positive x axis. |
| In the text | |
|
Fig. 3. Slice along the x-axis of Models M08_03 (left), M10_05 (center) and M10_10 (right) showing the 56Ni abundance in mass fraction for the converging shock, scissors and edge-lit mechanism, respectively. |
| In the text | |
|
Fig. 4. Angle-averaged bolometric light curves. For comparison we also show Model M2a from Gronow et al. (2020) and Model 3 from Fink et al. 2010 (FM3). |
| In the text | |
|
Fig. 5. Bolometric line of sight dependent light curves for models M08_03 (converging shock), M10_05 (scissors), and M10_10 (edge-lit). |
| In the text | |
|
Fig. 6. Left: peak bolometric magnitude plotted against Δm15(bol). Right: bolometric decline rate over 40 days, Δm40(bol), plotted against the decline rate over 15 days, Δm15(bol). We show the angle-averaged light curve values (circles) and 100 different viewing angles (x) for each model. We include Model M2a (Gronow et al. 2020) for comparison. The error bars show the standard deviation of the viewing angle distributions. We also plot the bolometric dataset of Scalzo et al. (2019). |
| In the text | |
Current usage metrics show cumulative count of Article Views (full-text article views including HTML views, PDF and ePub downloads, according to the available data) and Abstracts Views on Vision4Press platform.
Data correspond to usage on the plateform after 2015. The current usage metrics is available 48-96 hours after online publication and is updated daily on week days.
Initial download of the metrics may take a while.