Fig. 6.
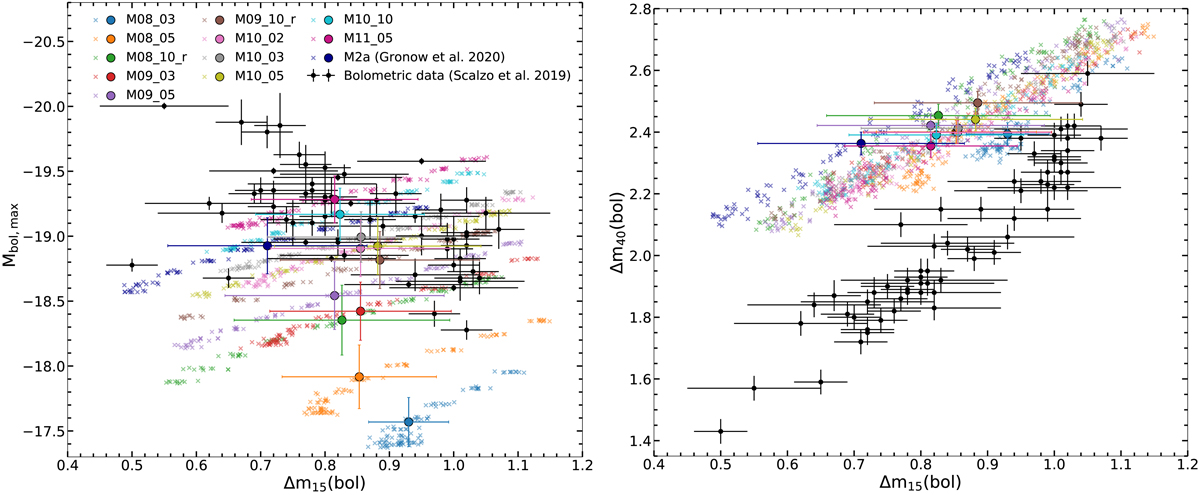
Left: peak bolometric magnitude plotted against Δm15(bol). Right: bolometric decline rate over 40 days, Δm40(bol), plotted against the decline rate over 15 days, Δm15(bol). We show the angle-averaged light curve values (circles) and 100 different viewing angles (x) for each model. We include Model M2a (Gronow et al. 2020) for comparison. The error bars show the standard deviation of the viewing angle distributions. We also plot the bolometric dataset of Scalzo et al. (2019).
Current usage metrics show cumulative count of Article Views (full-text article views including HTML views, PDF and ePub downloads, according to the available data) and Abstracts Views on Vision4Press platform.
Data correspond to usage on the plateform after 2015. The current usage metrics is available 48-96 hours after online publication and is updated daily on week days.
Initial download of the metrics may take a while.