Fig. 9.
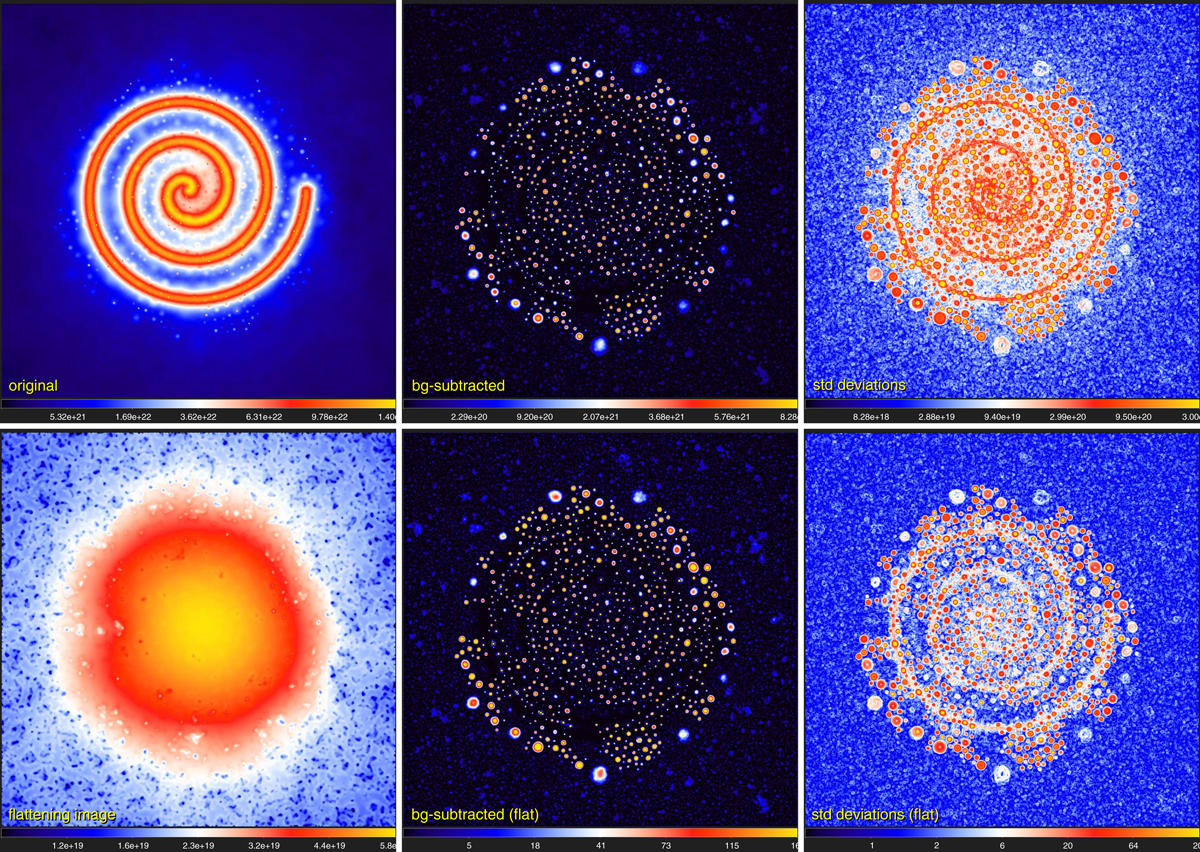
Flattening for the component 𝒮ƛ (Sect. 3.3) for ℐƛ ≡ 𝒟13″ from Eq. (8). The top row shows the original ℐƛ, the background-subtracted 𝒮ƛ from Eq. (23), and the standard deviations 𝒰ƛ from Eq. (24). The bottom row shows the flattening 𝒬ƛ, the flat sources 𝒮ƛD from Eq. (27), and its standard deviations ![]() that are much flatter (outside the sources) across the image. Square-root color mapping, except in the right panels, which show logarithmic mapping.
that are much flatter (outside the sources) across the image. Square-root color mapping, except in the right panels, which show logarithmic mapping.
Current usage metrics show cumulative count of Article Views (full-text article views including HTML views, PDF and ePub downloads, according to the available data) and Abstracts Views on Vision4Press platform.
Data correspond to usage on the plateform after 2015. The current usage metrics is available 48-96 hours after online publication and is updated daily on week days.
Initial download of the metrics may take a while.