Fig. 8.
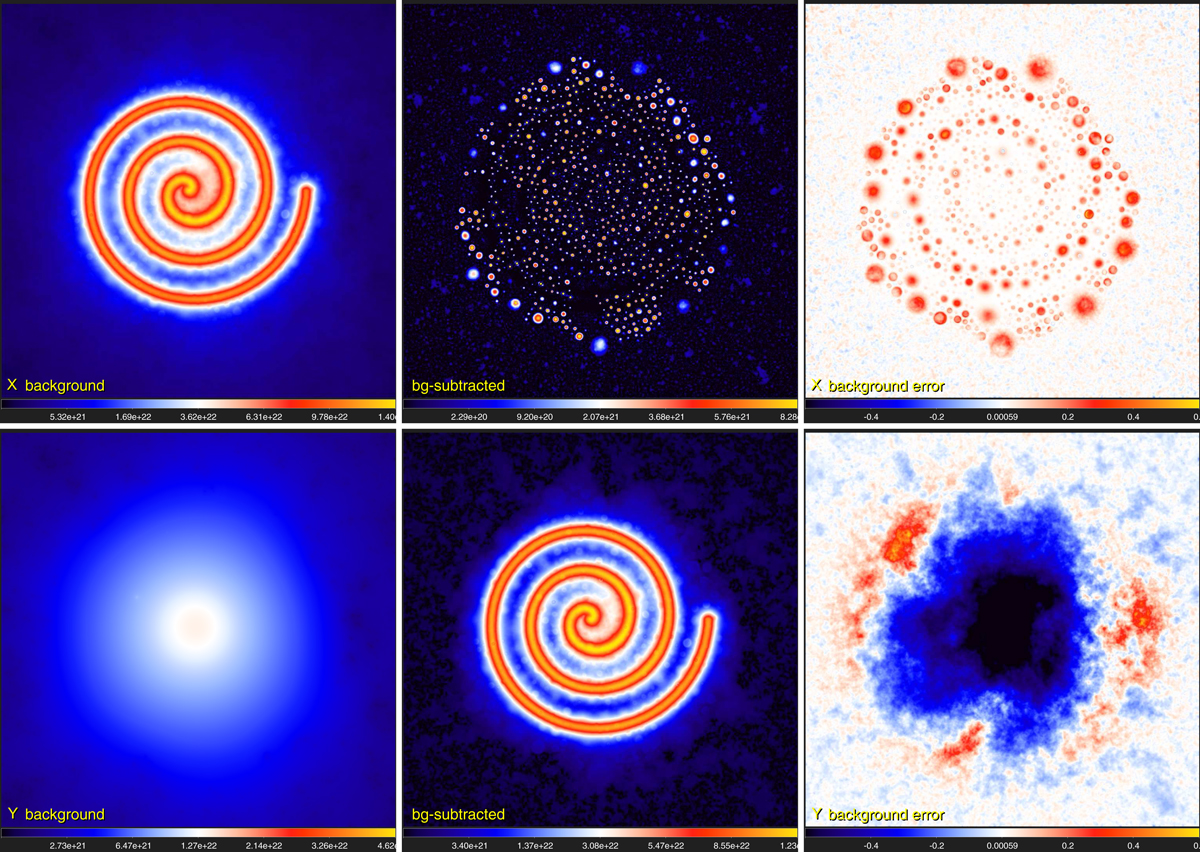
Background derivation (Sect. 3.2) for ℐƛ ≡ 𝒟13″ from Eq. (8). The left panels show the backgrounds ℬƛX and ℬƛY, obtained using the procedure described by Eqs. (20)–(22). The middle panels show the corresponding background-subtracted 𝒮ƛ and ℱƛ from Eq. (23). The right panels show the relative errors of ℬƛX and ℬƛY with respect to the true model backgrounds 𝒟C and 𝒟B (Fig. 2), convolved to the same resolution. The filament is heavily blended with itself in the central area, therefore its background is systematically underestimated there (lower right). Square-root color mapping, except in the right panels, which show linear mapping.
Current usage metrics show cumulative count of Article Views (full-text article views including HTML views, PDF and ePub downloads, according to the available data) and Abstracts Views on Vision4Press platform.
Data correspond to usage on the plateform after 2015. The current usage metrics is available 48-96 hours after online publication and is updated daily on week days.
Initial download of the metrics may take a while.